


 全部商品分类
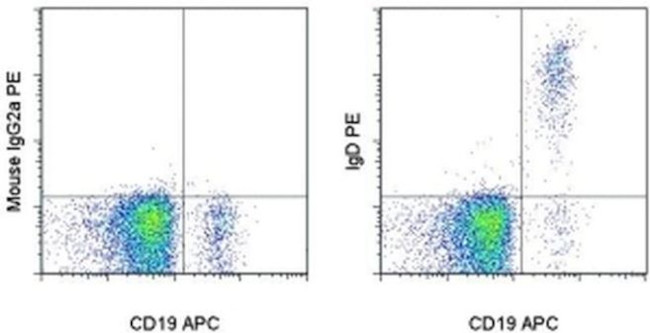


ANTI-HU IGD IA6-2 PE

 下载产品说明书 下载COA 下载SDS
 用小程序,查商品更便捷


 收藏
收藏
 对比
对比 咨询
咨询
种属反应
已发表种属
宿主/亚型
分类
类型
克隆号
偶联物
激发/发射光谱

形式
浓度
纯化类型
保存液
内含物
保存条件
运输条件
RRID
产品详细信息
Description: This IA6-2 monoclonal antibody reacts with the heavy chain of human immunoglobulin D (IgD). This type I transmembrane protein is co-expressed on the surface of mature naive B cells with membrane IgM. IgD also exists as a soluble form in blood serum. Studies have demonstrated that IgD associates with the B cell receptor and participates in mediating signal transduction upon antigen binding.
Applications Reported: This IA6-2 antibody has been reported for use in flow cytometric analysis.
Applications Tested: This IA6-2 antibody has been pre-titrated and tested by flow cytometric analysis of normal human peripheral blood cells. This can be used at 5 µL (0.06 µg) per test. A test is defined as the amount (µg) of antibody that will stain a cell sample in a final volume of 100 µL. Cell number should be determined empirically but can range from 10^5 to 10^8 cells/test.
Excitation: 488-561 nm; Emission: 578 nm; Laser: Blue Laser, Green Laser, Yellow-Green Laser.
Filtration: 0.2 µm post-manufacturing filtered.
靶标信息
This type I transmembrane protein is co-expressed on the surface of mature naive B cells with membrane IgM. IgD also exists as a soluble form in blood serum. Studies have demonstrated that IgD associates with the B cell receptor and participates in mediating signal transduction upon antigen binding.
仅用于科研。不用于诊断过程。未经明确授权不得转售。
生物信息学
Entrez Gene ID:(Human) 3495
参考图片
Staining of normal human peripheral blood cells with Anti-Human CD19 APC (Product # 17-0198-42) and Mouse IgG2a K Isotype Control PE (Product # 12-4724-81) (left) or Anti-Human IgD PE (right). Cells in the lymphocyte gate were used for analysis.
Figure 3 Phenotypic characterization of circulating B cell subsets in patients and HC. (A) Gated by CD19 + B cells, IgD + CD27 - NB, IgD + CD27 + USM B cells, IgD - CD27 + SM B cells, and IgD - CD27 - DN B cells were identified. The graphs are representative for HC and patients with different duration. Mean value of each B cell subset's percentage is shown in the quadrants. (B) Statistical graphs for comparison of CD19 + B cells' percentages between patient groups and HC. (C-E) Statistical graphs for distinct CD19 + B cells subsets between patients (SP, n = 48; SD, n = 23; LD, n = 25; FF, n = 33; LF, n = 15.) and HC (n = 25). Error bars represent mean+-SD. * P < 0.05, ** P < 0.01, *** P < 0.001, and NS P >= 0.05.