


 全部商品分类


ANTI-MO/RT IL-1B B122 PUR

 下载产品说明书 下载COA 下载SDS
 用小程序,查商品更便捷


 收藏
收藏
 对比
对比 咨询
咨询
种属反应
已发表种属
宿主/亚型
分类
类型
克隆号
偶联物
形式
浓度
纯化类型
保存液
内含物
保存条件
运输条件
RRID
产品详细信息
Description: The B122 antibody reacts with mouse and rat interleukin-1beta (IL-1beta), a 17 kDa factor secreted primarily by monocytes. IL-1 has effects on T-helper cells, inducing IL-2 secretion and expression of IL-2 receptors.
Applications Reported: The B122 antibody has been reported for use in cytokine neutralization, immunoblotting (WB), and ELISA. Please refer to Functional Grade purified B122 (Product # 16-7012) for functional assays.
Applications Tested: The B122 antibody has been tested as the capture antibody in a sandwich ELISA for analysis of mouse interleukin-1 beta (IL-1 beta) in combination with the biotinylated polyclonal anti-mouse interleukin-1 beta for detection and recombinant mouse IL-1 beta (14-8012) as the standard. A suitable range of concentrations of this antibody for ELISA capture is 1-4 µg/mL. A standard curve consisting of doubling dilutions of the recombinant standard over the range of 2000 pg/mL - 15 pg/mL should be included in each ELISA plate.
Purity: Greater than 90%, as determined by SDS-PAGE.
Aggregation: Less than 10%, as determined by HPLC.
Filtration: 0.2 µm post-manufacturing filtered.
靶标信息
Interleukin-1 beta (IL-1 beta) is a proinflammatory cytokine expressed by monocytes, macrophages, and dendritic cells. IL-1 beta is synthesized in response to inflammatory stimuli as a 31 kDa inactive pro-form that accumulates in the cytosol. Cleavage of pro-IL-1 beta into the active 17 kDa protein requires the activation of inflammasomes, which are multi-protein complexes that respond to pathogens, stress conditions, and other danger signals. Inflammasome activation triggers the processing of the caspase-1 precursor into its active form, which in turn cleaves pro-IL-1 beta. IL-1 beta lacks a signal sequence peptide for classical ER/Golgi pathway and is secreted alongside caspase-1 via an alternate and incompletely understood mechanism. Although IL-1 beta is most often secreted in its active form, secretion of the uncleaved protein may be detectable under some biological conditions. IL-1 beta signals through two receptors, IL-1RI and IL-1RII, both of which are shared with IL-1 alpha. IL-1 beta activity can be moderated by IL-1 Receptor Antagonist (IL-1RA), a protein produced by many cell types that blocks receptor binding through competitive inhibition. IL-1 beta play an important role in innate host defense by triggering the production of other proinflammatory cytokines in target cells and initiating acute-phase responses to infection and injury. Elevated levels of IL-1 beta have been associated with many chronic inflammatory conditions IL-1 beta neutralizing antibodies potential therapeutic value.
仅用于科研。不用于诊断过程。未经明确授权不得转售。
生物信息学
蛋白别名: Hematopoietin 1 (H1); IFN beta inducing factor; il 1b; IL 1β; IL-1 beta; IL1 B; IL1β; ILN; Interleukin; Interleukin 1 beta precursor; Interleukin-1 beta; Interleukin-1b; Interleukin1 beta; LAF; Osteoclast activating factor (OAF); Pro interleukin 1 beta
基因别名: Il-1b; IL-1beta; Il1b
UniProt ID:(Mouse) P10749
Entrez Gene ID:(Mouse) 16176, (Rat) 24494
参考图片
FIG. 1 Differential activation between tissue-resident and TG-elicited peritoneal macrophages from young mice. Peritoneum-resident (Mph)- and TG-elicited peritoneum macrophages (TG-Mph) were isolated from young mice (Y, 8 weeks old). Total cell numbers (n=5/each group) were counted (A), and phagocytotic activity (n=5/each group) was quantified (B). The ratio for Mph was arbitrarily defined as 100%, and the ratios for TG-Mph were expressed as relative values. (C) The cell surface expression of CD11b (M1 polarization marker) and CD206 (M2 polarization marker) in a F4/80-gated population of peritoneum-resident and TG-elicited peritoneum macrophages (n=5/each group) was analyzed by flow cytometry. (D) Cells (n=5/each group) were stimulated with LPS (5 mg/mL). IL-6, TNF-alpha, and IL-1beta, and IL-10 levels were analyzed by ELISA. * p <0.05; ** p <0.01. # p <0.05; ## p <0.01 compared with non-treated and LPS-treated macrophages. LPS: lipopolysaccharide, TG: thioglycollate.
FIG. 2 Differential activation between tissue-resident and TG-elicited peritoneal macrophages from old mice. Mph and TG-Mph were isolated from old mice (O, 24 months). Total cell numbers (n=5/each group) were counted (A), and phagocytotic activity (n=5/each group) was quantified (B). (C) The cell surface expression of CD11b and CD206 in a F4/80-gated population of Mph and TG-Mph (n=5/each group) was analyzed by flow cytometry. (D) Cells (n=5/each group) were stimulated with LPS (5 µg/mL). IL-6, TNF-alpha, IL-1beta, IL-10 levels were analyzed by ELISA. * p <0.05; ** p <0.01; *** p <0.001. # p <0.05 compared with non-treated and LPS-treated macrophages. NS indicates not significant.
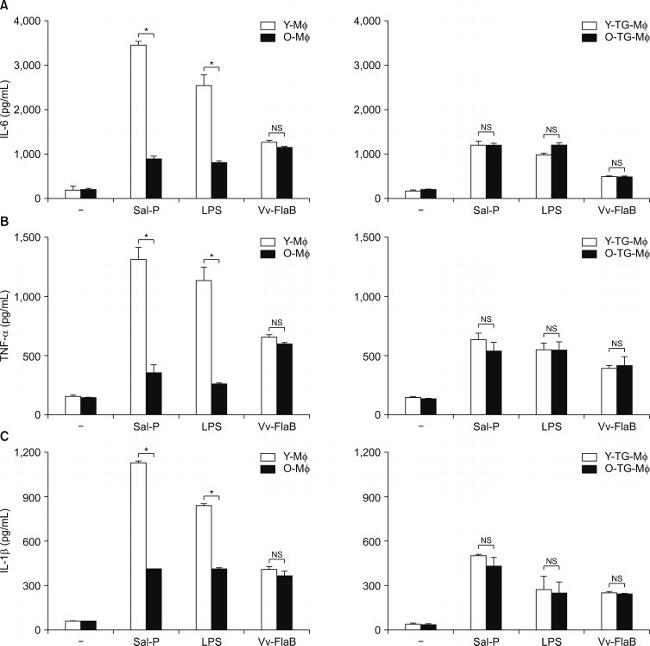
FIG. 4 Age-associated functional alterations of peritoneum-resident macrophages. After isolation of Mph and TG-Mph from Y- and O-mice, cells (n=5/each group) were stimulated with Salmonella extract proteins (Sal-P) (10 µg/mL), LPS (5 µg/mL), and Vv-FlaB (100 ng/mL). IL-6 (A), TNF-alpha (B), and IL-1beta (C) levels were analyzed by ELISA. * p <0.05; NS indicates not significant. Vv-FlaB: Vibrio vulnificus major flagellin recombinant proteins.
Figure 4 Peli1 mediates LPS-induce inflammatory responses in microglia. ( a ) QPCR analysis of relative mRNA expression for the indicated inflammatory genes in the primary cultured microglia isolated from WT and Peli1 -KO mice, left untreated (NT) or stimulated with LPS (100 ng/ml). ( b ) ELISA of IL-1beta, IL-6, TNF and nitrites in the supernatant of WT and Peli1 -KO microglia cultures that left untreated (NT) or stimulated with LPS (100 ng/ml) at the indicated time points. ( c , d ) QPCR analysis of relative mRNA expression for the indicated inflammatory genes in the primary cultured microglia ( c ) or astrocytes ( d ) isolated from WT and Peli1 -KO mice, left untreated (NT) or stimulated with IL-1beta (20 ng/ml). The gene expression were normalized to a reference gene Actb (encoding beta-actin) and showed as the relative value to Actb in bar graphs. Data with error bars represent mean +- SD. Each panel is representative of at least three independent experiment. *P < 0.05, **P < 0.01 as determined by two-way ANOVA with a Bonferroni post test.
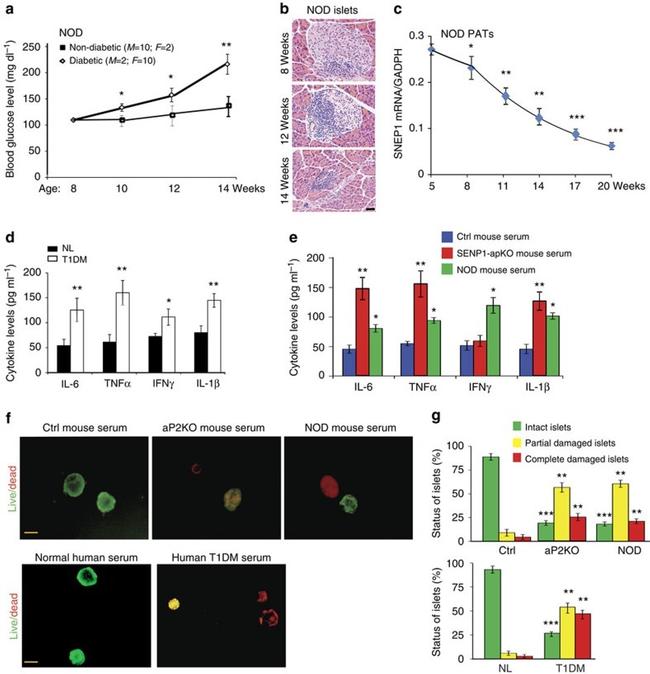
Figure 5 SENP1 deletion alters pancreatic adipocyte phenotype and augments NF-kappaB-dependent inflammation. ( a , b ) Pancreatic adipose was collected from 7 and 14 weeks old Ctrl and SENP1-aP2KO male (male, n =6). Morphology was visualized by haematoxylin and eosin stain staining. Scale bar, 20 mum ( a ). Cell sizes were quantified in ( b ). Three sections from each adipose tissue. Data are representative for three independent experiments. ( c ) Transcript levels of adipocyte differentiation markers (fatty acid synthase, adipose triglyceride lipase and lipoprotein lipase) in PATs were quantified by quantitative PCR with reverse transcription with GAPDH for normalization. n =6, male for each group. ( d ) Increased IKK-NF-kappaB activities in SENP1-aP2KO PATs. A representative western blot was from Ctrl and SENP1-aP2KO mice at the age of 7 weeks. Data are representative from three independent experiments is shown ( n =6, male). Relative protein levels were quantified from three blots by taking Ctrl as 1.0 ( n =6, male). ( e - h ) NF-kappaB activation is specifically detected in PATs of SENP1-aP2KO mice. ( e ) Phosphor-p65 staining (red) in PATs but not in pancreas. ( f ) Co-immunostaining of phosphor-p65 (green) and adipocyte marker FABP4 (red). ( g ) High-power images show co-staining of phosphor-p65 (red) in the nucleus of FABP4 + adipocytes (green). ( h ) Co-staining of phosphor-p65 (green) with APC-conjugated adipocyte marker FABP4 (green; yellow arrowheads), but not with
Figure 6 SENP1 deletion augments NEMO SUMOylation and cytokine expression in the adipocytes. ( a , b ). SUMOylation of NEMO, but not p65/RelA, was enhanced in the adipocytes of SENP1-aP2KO mice. Proteins extracted from the adipocytes of Ctrl and SENP1-aP2KO mice at the age of 5 weeks were subjected to immunoprecipitation with p65/RelA ( a ) or NEMO ( b ) antibodies followed by western blotting with anti-SUMO1, anti-p65/RelA or anti-NEMO. Proteins are indicated. Representative blots from one pair of Ctrl and SENP1-aP2KO mice are shown. Similar results were obtained from additional two pairs of mice. ( c ) Flag-tagged NEMO was transfected into adipocytes from Ctrl and SENP1-aP2KO mice at the age of 5 weeks. Proteins extracted were subjected to immunoprecipitation with SUMO1 antibody followed by western blotting with anti-flag. Input for flag-NEMO was detected with flag antibody. Representative blots from one pair of Ctrl and SENP1-aP2KO mice are shown. Similar results were obtained from additional two pairs of mice. ( d ) Effect of SENP1 deletion on stress-induced IKK activation, p65/RelA phosphorylation and NEMO SUMOylation. Adipocytes from Ctrl and SENP1-aP2KO mice were treated with VP16 (10 muM) for indicated times. IKK-NF-kappaB p65/RelA signalling molecules were determined by western blot. Ratios of p-IKK/IKK, p-p65/RelA/p65/RelA and pIkappaB-alpha were quantified by taking Ctrl as 1.0. Representative blots from one pair of Ctrl and SENP1-aP2KO mice are shown. Similar
Published figure using IL-1 beta monoclonal antibody (Product # 14-7012-81) in ELISA
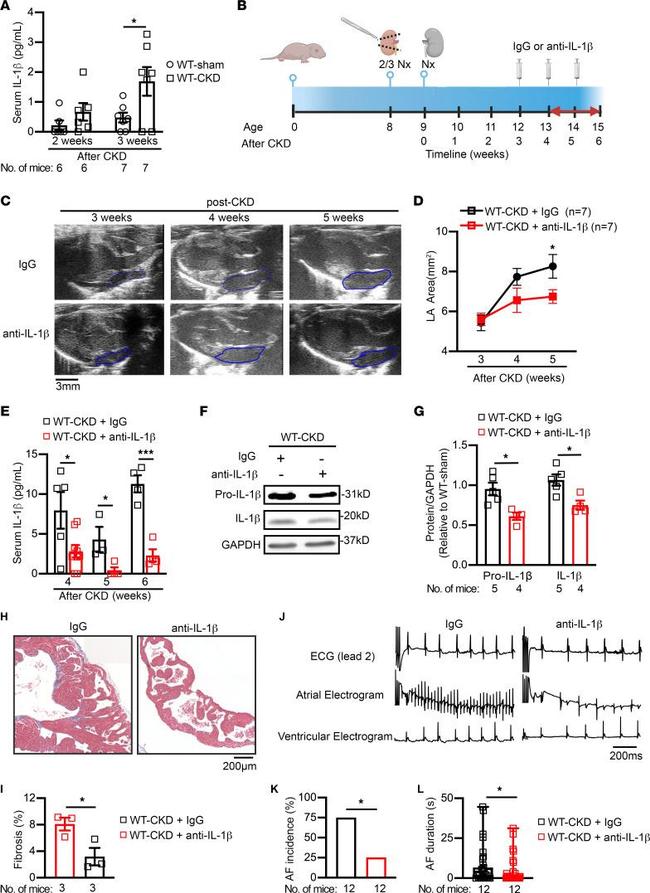
Neutralization of circulating IL-1beta attenuates CKD-induced atrial arrhythmogenesis. ( A ) Serum levels of IL-1beta in WT mice 2 and 3 weeks after sham or CKD surgeries. ( B ) Timeline of anti-IL-1beta antibody (5 mg/kg, i.p.) or IgG (as a control) injections into WT-CKD mice. 2/3 Nx, two-thirds nephrectomy. Panel B was created with BioRender.com. ( C and D ) Representative echocardiographic long-axis views of the heart ( C ) and quantification of the LA area ( D ) in WT-CKD mice that received IgG or anti-IL-1beta antibody injections. Blue outlined areas indicate the LA. Scale bar: 3 mm. ( E ) Serum levels of IL-1beta in WT-CKD mice that received IgG or anti-IL-1beta antibody injections following the CKD procedure. ( F and G ) Representative Western blots ( F ) and quantification ( G ) of IL-1beta in atrial tissue of WT-CKD mice after 3 weekly injections of IgG or anti-IL-1beta antibody. ( H and I ) Representative images ( H ) of Masson's trichrome staining in atria and quantification of atrial fibrosis ( I ) in WT-CKD mice after 3 weekly injections of IgG or anti-IL-1beta antibody. Scale bar: 200 mum. ( J - L ) Representative lead 2 surface ECG and intracardial ECG recordings ( J ), incidence ( K ), and duration ( L ) of pacing-induced AF in WT-CKD mice after 3 injections of IgG or anti-IL-1beta antibody. Scale bar: 200 ms ( J ). Data are expressed as the mean +- SEM in A , D , E , G , I , and L , and as a percentage in K. * P < 0.05 and *** P < 0.001, by unpaired, 2-taile
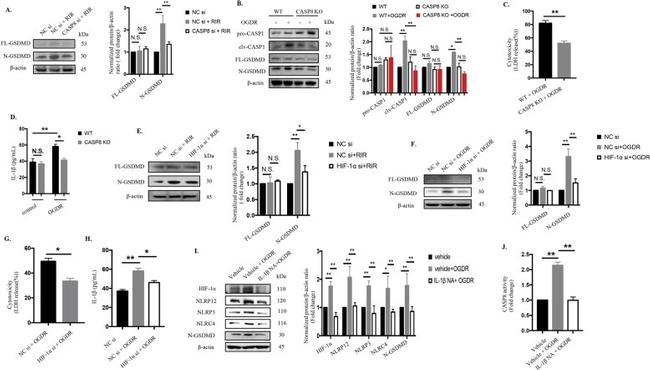
Fig. 7 Activation of the CASP8-HIF-1alpha pathway elicits pyroptosis and promotes IL-1beta production which in turn magnifies inflammatory cascades via the CASP8-HIF-1alpha-NLR axis. a The protein levels of cleaved GSDMD were detected in retinas from WT mice with or without CASP8 knockdown (20 muMu) that were harvested at the seventh day after reperfusion ( n = 6). The protein levels were normalized to beta-actin levels. b Western blot analysis of cleaved CASP1 and GSDMD in extracts from WT BV2 microglia and CASP8-specific KO cell line after OGDR injury ( n = 6). The protein levels were normalized to beta-actin levels. c-d Cytotoxicity c and IL-1beta production d in BV2 microglia under OGDR injury ( n = 6). e-f The protein levels of cleaved GSDMD were detected in vivo and in vitro with or without HIF-1alpha knockdown. The protein levels were normalized to beta-actin levels. g-h Cytotoxicity g and IL-1beta processing h were measured in the presence or absence of HIF-1alpha siRNA treatment in BV2 microglia ( n = 6, both). i Western blotting detection of the indicated proteins in BV2 microglia subjected to OGDR and OGDR concomitant with IL-1beta neutralizing antibody treatment ( n = 6). The protein levels were normalized to beta-actin levels. j CASP8 activity ( n = 6). The data shown are representative of at least three independent experiments. Data are represented as the mean +- SD. * P < 0.05, ** P < 0.01, experiments were assessed by one-way ANOVA, two-way ANOVA or two-tailed
Fig. 3. NLRP12 collaborates with NLRP3 and NLRC4 to elicit pyroptosis and promote IL-1beta production in ischemic injury through CASP1-dependent GSDMD cleavage a - h NLRP12/NLRP3/NLRC4 promoted IL-1beta release and induced pyroptosis by CASP1-dependent GSDMD cleavage: a Knockdown of NLRP12/NLRP3/NLRC4 reduced CASP1 and GSDMD cleavage in extracts from BV2 microglia after OGDR injury, as determined by western blot analysis (n = 6). The protein levels were normalized to beta-actin levels. b LDH release (n = 6). c IL-1beta secretion (n = 6). d - e LDH release ( d ) and IL-1beta production ( e ) of BV2 microglia treated with the CASP1 inh, YVAD (200 µM) and subjected to OGDR injury (n = 6). f Representative SEM images showed pyroptotic cell death and other morphological changes in BV2 microglia subjected to OGDR combined with or without different additional treatments (n = 5): (i): control; (ii): OGDR; (iii): OGDR plus CASP1 inh (YVAD, 200 uM); (iv): OGDR plus NLRP3 siRNA (si); (v): OGDR plus NLRP12 si; (vi): OGDR plus NLRC4 si; (vii): CASP8 CRISPR plus OGDR; (viii): OGDR plus HIF-1alpha si ; (ix): OGDR plus IL-1beta neutralizing antibody. Scale bar: 20 um. g - h Immunoblotting analysis for detection of pyroptotic proteins in the retinas of NLRP12-/- or WT mice with or without NLRP3/NLRC4 knockdown under RIR conditions (n = 6). The protein levels were normalized to beta-actin levels. i - n Mutual regulatory relationships among NLRP12, NLRP3 and NLRC4: i - j Protein expressio
Published figure using IL-1 beta monoclonal antibody (Product # 14-7012-81) in Neutralization