


 全部商品分类


BD Horizon™ BB700 Rat Anti-Mouse CD4


 下载产品说明书 下载SDS
 用小程序,查商品更便捷


 收藏
收藏
 对比
对比 咨询
咨询
参考图片
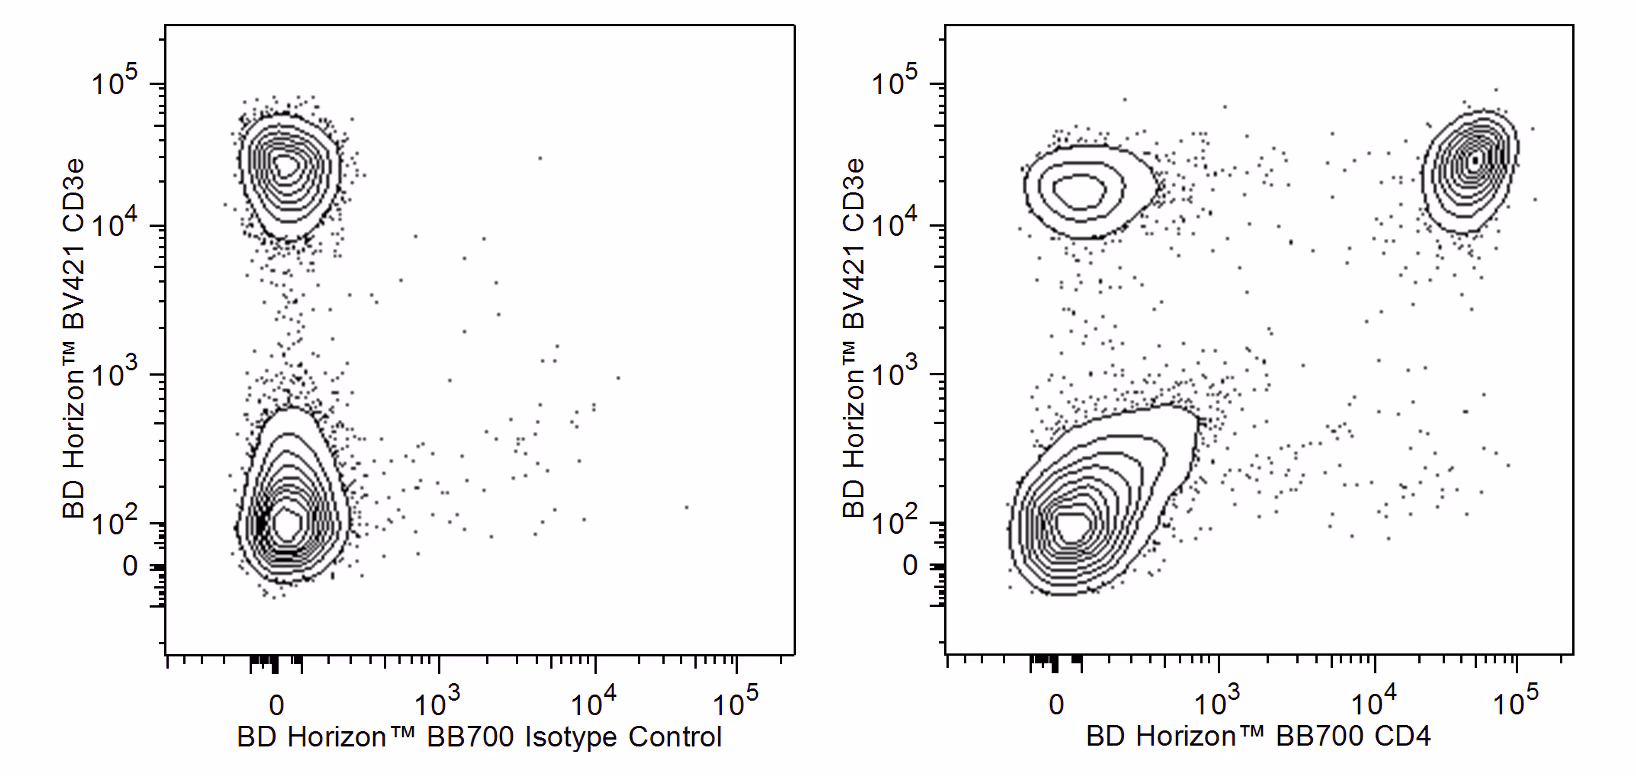
Two-color flow cytometric analysis of CD4 expression on mouse splenocytes. Mouse splenic leucocytes were preincubated with Purified Rat Anti-Mouse CD16/CD32 antibody (Mouse BD Fc Block™) (Cat. No. 553141/553142). The cells were then stained with BD Horizon™ BV421 Hamster Anti-Mouse CD3e antibody (Cat. No. 562600) and either BD Horizon™ BB700 Rat IgG2a, κ Isotype Control (Cat. No. 566413; Left Plot) or BD Horizon BB700 Rat Anti-Mouse CD4 antibody (Cat. No. 566407/566408; Right Plot) at 0.5 μg/test. The two-color contour plot showing the correlated expression of CD4 (or Ig Isotype control staining) versus CD3e was derived from gated events with the forward and side light-scatter characteristics of viable splenic leucocytes. Flow cytometric analysis was performed using a BD FACSymphony™ A5 Cell Analyzer System. Data shown on this Technical Data Sheet are not lot specific.
Two-color flow cytometric analysis of CD4 expression on mouse splenocytes. Mouse splenic leucocytes were preincubated with Purified Rat Anti-Mouse CD16/CD32 antibody (Mouse BD Fc Block™) (Cat. No. 553141/553142). The cells were then stained with BD Horizon™ BV421 Hamster Anti-Mouse CD3e antibody (Cat. No. 562600) and either BD Horizon™ BB700 Rat IgG2a, κ Isotype Control (Cat. No. 566413; Left Plot) or BD Horizon BB700 Rat Anti-Mouse CD4 antibody (Cat. No. 566407/566408; Right Plot) at 0.5 μg/test. The two-color contour plot showing the correlated expression of CD4 (or Ig Isotype control staining) versus CD3e was derived from gated events with the forward and side light-scatter characteristics of viable splenic leucocytes. Flow cytometric analysis was performed using a BD FACSymphony™ A5 Cell Analyzer System. Data shown on this Technical Data Sheet are not lot specific.