


 全部商品分类


BD Horizon™ APC-R700 Rat Anti-Mouse F4/80


 下载产品说明书 下载SDS
 用小程序,查商品更便捷


 收藏
收藏
 对比
对比 咨询
咨询
参考图片
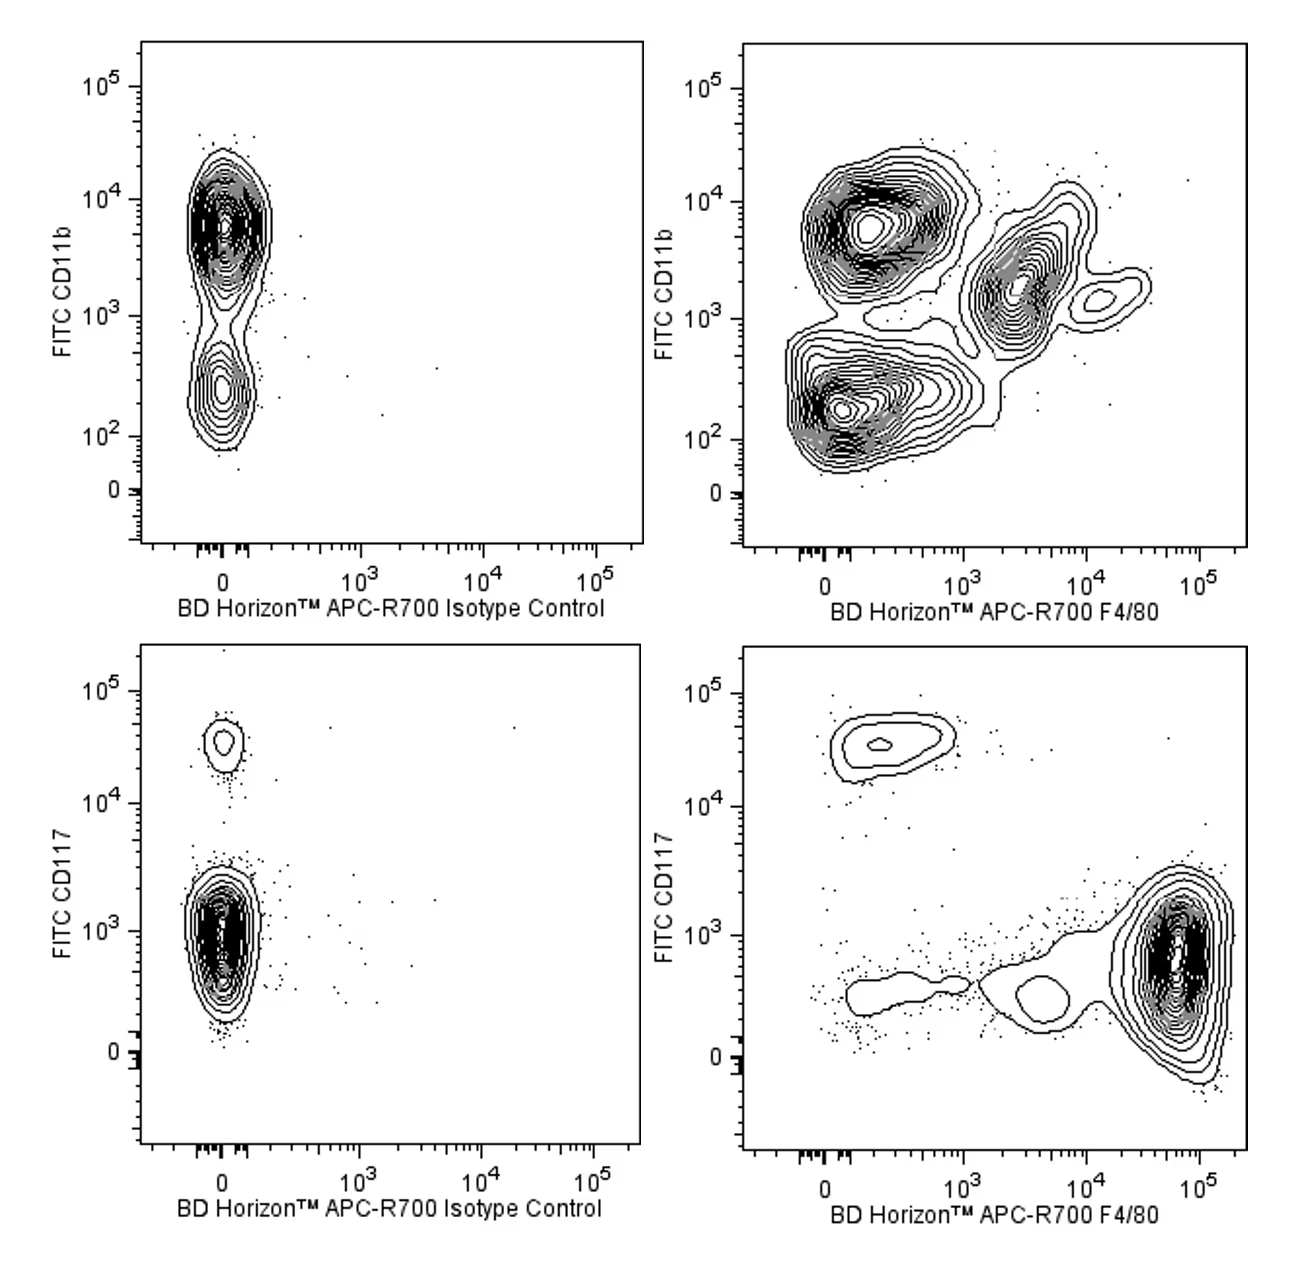
Two-color flow cytometric analyses of F4/80 expression. The two-color flow cytometric contour plots showing the correlated expression of F4/80 (or Ig Isotype control staining) versus CD11b (Mouse Splenocytes; Top Plots) or CD117 (Mouse Peritoneal Exudate Cells; Bottom Plots) were derived from gated events with the forward and side light-scatter characteristics of viable (7-AAD-negative) monocytes. Flow cytometric analyses were performed using a BD LSRFortessa™ Cell Analyzer System. Data shown on this Technical Data Sheet are not lot specific. Top Plots - Mouse splenocytes. C57BL/6 mouse splenic leucocytes were preincubated with Purified Rat Anti-Mouse CD16/CD32 antibody (Mouse BD Fc Block™) (Cat. No. 553141/553142) and stained with FITC Rat Anti- CD11b antibody (Cat. No. 553310/557396/561688) and either BD Horizon™ APC-R700 Rat IgG2a Isotype Control (Cat. No. 564982; Left Plot) or BD Horizon APC-R700 Rat Anti-Mouse F4/80 antibody (Cat. No. 565787; Right Plot) at 0.5 µg/test. BD Via-Probe™ Cell Viability 7-AAD Solution (Cat. No. 555815/555816) was added to cells right before analysis. Bottom Plots - Mouse peritoneal exudate cells (PEC). C57BL/6 mouse PEC were similarly pretreated with Mouse BD Fc Block™, stained with FITC Rat Anti-Mouse CD117 antibody (Cat. No. 553354/561680) and either BD Horizon™ APC-R700 Rat IgG2a Isotype Control (Left Plot) or BD Horizon APC-R700 Rat Anti-Mouse F4/80 antibody (Right Plot) at 0.5 µg/test flowed by BD Via-Probe™ Cell Viability 7-AAD Solution, and analyzed.