The MQ1-17H12 monoclonal antibody specifically binds to the multifunctional cytokine, human Interleukin-2 (IL-2). IL-2 is produced by activated T cells and has multiple functions that can affect the growth, proliferation, differentiation and survival of many different target cell types including T cells, B cells, NK cells, monocytes and macrophages. The immunogen used to generate the MQ1-17H12 hybridoma was purified recombinant human IL-2 protein. The MQ1-17H12 antibody reportedly neutralizes the biological activity of human IL-2.
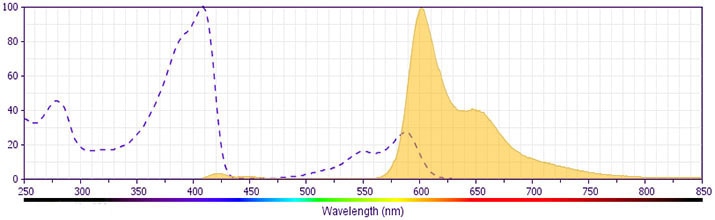
This antibody is conjugated to BD Horizon BV605 which is part of the BD Horizon Brilliant™ Violet family of dyes. With an Ex Max of 407-nm and Em Max of 602-nm, BD Horizon BV605 can be excited by a violet laser and detected with a standard 610/20-nm filter set. BD Horizon BV605 is a tandem fluorochrome of BD Horizon BV421 and an acceptor dye with an Em max at 605-nm. Due to the excitation of the acceptor dye by the green (532 nm) and yellow-green (561 nm) lasers, there will be significant spillover into the PE and BD Horizon PE-CF594 detectors off the green or yellow-green lasers. BD Horizon BV605 conjugates are very bright, often exhibiting brightness equivalent to PE conjugates and can be used as a third color off of the violet laser.
商品描述
MQ1-17H12
The MQ1-17H12 monoclonal antibody specifically binds to the multifunctional cytokine, human Interleukin-2 (IL-2). IL-2 is produced by activated T cells and has multiple functions that can affect the growth, proliferation, differentiation and survival of many different target cell types including T cells, B cells, NK cells, monocytes and macrophages. The immunogen used to generate the MQ1-17H12 hybridoma was purified recombinant human IL-2 protein. The MQ1-17H12 antibody reportedly neutralizes the biological activity of human IL-2.
This antibody is conjugated to BD Horizon BV605 which is part of the BD Horizon Brilliant™ Violet family of dyes. With an Ex Max of 407-nm and Em Max of 602-nm, BD Horizon BV605 can be excited by a violet laser and detected with a standard 610/20-nm filter set. BD Horizon BV605 is a tandem fluorochrome of BD Horizon BV421 and an acceptor dye with an Em max at 605-nm. Due to the excitation of the acceptor dye by the green (532 nm) and yellow-green (561 nm) lasers, there will be significant spillover into the PE and BD Horizon PE-CF594 detectors off the green or yellow-green lasers. BD Horizon BV605 conjugates are very bright, often exhibiting brightness equivalent to PE conjugates and can be used as a third color off of the violet laser.
同种型
Rat IgG2a, κ
克隆号
克隆 MQ1-17H12 (also known as MQ17H12) (RUO)
产品详情
BV605
The BD Horizon Brilliant Violet™ 605 (BV605) dye is part of the BD Horizon Brilliant Violet™ family of dyes. This tandem fluorochrome is comprised of a BV421 donor with an excitation maximum (Ex Max) of 407-nm and an acceptor dye with an emission maximum (Em Max) at 605-nm. BV605, driven by BD innovation, is designed to be excited by the violet laser (405-nm) and detected using an optical filter centered near 610-nm (e.g., a 610/20-nm bandpass filter). The acceptor dye can be excited by the yellow-green (561-nm) laser resulting in cross-laser excitation and fluorescence spillover. Please ensure that your instrument’s configurations (lasers and optical filters) are appropriate for this dye.
Aqueous buffered solution containing BSA and ≤0.09% sodium azide.
文献
文献
研发参考(3)
1. Abrams J. Immunoenzymetric assay of mouse and human cytokines using NIP-labeled anti-cytokine antibodies. Curr Protoc Immunol. 2001; 1:6.20-6.21. (Clone-specific: ELISA).
2. Abrams JS, Roncarolo MG, Yssel H, Andersson U, Gleich GJ, Silver JE. Strategies of anti-cytokine monoclonal antibody development: immunoassay of IL-10 and IL-5 in clinical samples. Immunol Rev. 1992; 127:5-24. (Clone-specific: Blocking, ELISA, Immunoprecipitation).
3. Prussin C, Metcalfe DD. Detection of intracytoplasmic cytokine using flow cytometry and directly conjugated anti-cytokine antibodies. J Immunol Methods. 1995; 188(1):117-128. (Methodology: Flow cytometry).
参考图片
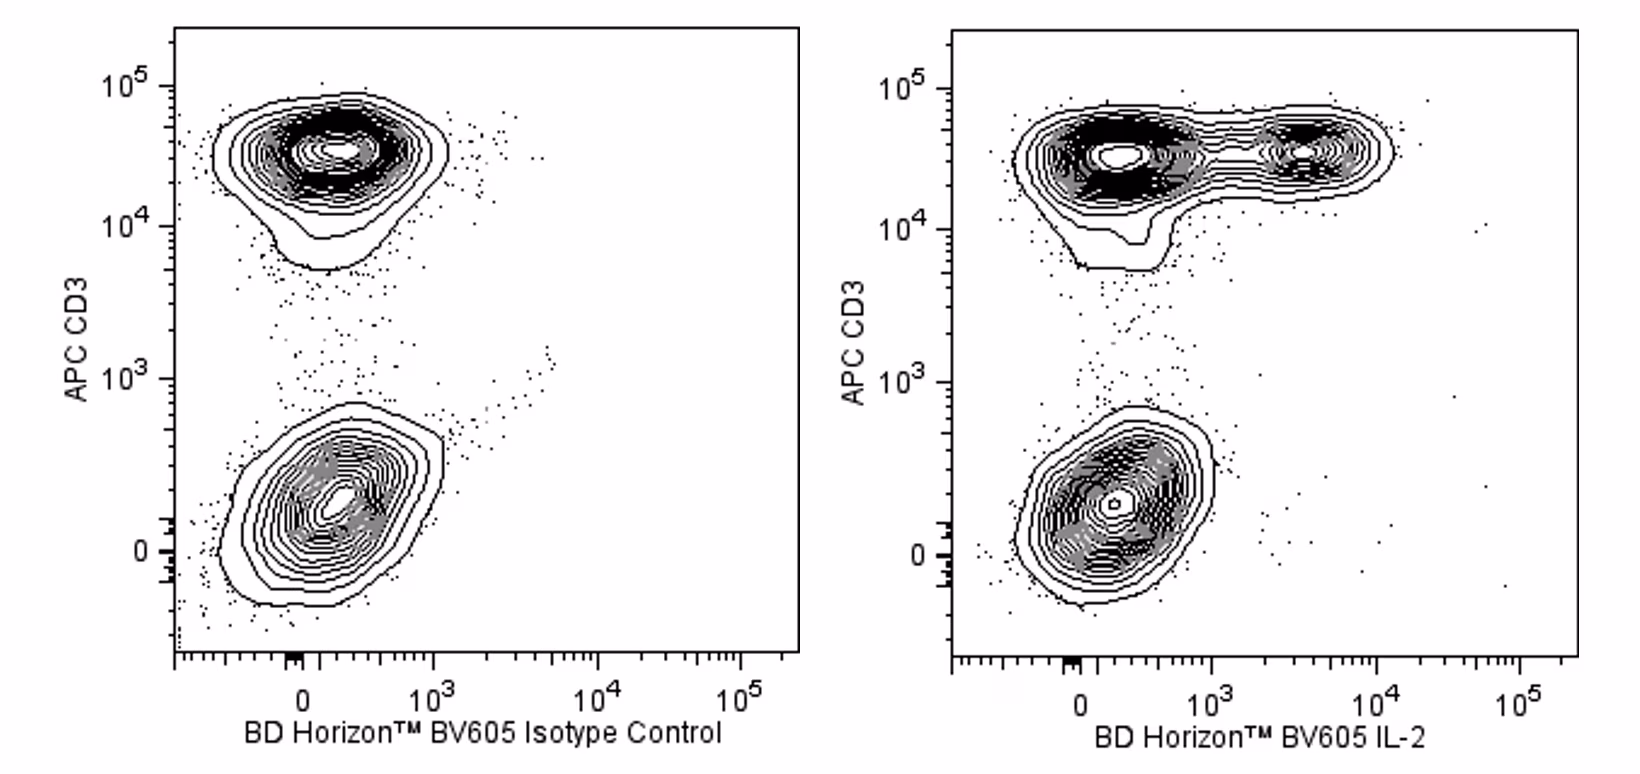
Two color flow cytometric analysis of IL-2 expression in activated human peripheral blood lymphocytes. Human peripheral blood mononuclear cells were stimulated for 5 h with Phorbol 12-Myristate 13-Acetate (PMA, Sigma P-8139; 50 ng/ml) and Calcium Ionophore A23187 (Sigma C-9275; 1 μ g/ml), in the presence of BD GolgiStop™ Protein Transport Inhibitor (containing Monensin) (Cat. No. 554724). The cells were fixed with BD Cytofix/Cytoperm™ Fixation and Permeabilization Solution (Cat. No. 554722), washed and permeabilized with BD Perm/Wash™ Buffer (Cat. No. 554723).
The cells were then stained with APC Mouse Anti-Human CD3 antibody (Cat No. 555335/561810/561811) and either BD Horizon™ BV605 Rat IgG2a, κ Isotype Control (Cat No. 563144; Left Panel) or BD Horizon BV605 Rat Anti-Human IL-2 antibody (Cat No. 564165; Right Panel) using BD Biosciences Intracellular Cytokine Staining Protocol. The two-color flow cytometric contour plots showing correlated expression of IL-2 (or Ig Isotype control staining) versus CD3 were derived from gated events with the forward and side light-scatter characteristics of intact lymphocytes. Flow cytometric analysis was performed using a BD LSRFortessa™ Cell Analyzer System.
Two color flow cytometric analysis of IL-2 expression in activated human peripheral blood lymphocytes. Human peripheral blood mononuclear cells were stimulated for 5 h with Phorbol 12-Myristate 13-Acetate (PMA, Sigma P-8139; 50 ng/ml) and Calcium Ionophore A23187 (Sigma C-9275; 1 μ g/ml), in the presence of BD GolgiStop™ Protein Transport Inhibitor (containing Monensin) (Cat. No. 554724). The cells were fixed with BD Cytofix/Cytoperm™ Fixation and Permeabilization Solution (Cat. No. 554722), washed and permeabilized with BD Perm/Wash™ Buffer (Cat. No. 554723). The cells were then stained with APC Mouse Anti-Human CD3 antibody (Cat No. 555335/561810/561811) and either BD Horizon™ BV605 Rat IgG2a, κ Isotype Control (Cat No. 563144; Left Panel) or BD Horizon BV605 Rat Anti-Human IL-2 antibody (Cat No. 564165; Right Panel) using BD Biosciences Intracellular Cytokine Staining Protocol. The two-color flow cytometric contour plots showing correlated expression of IL-2 (or Ig Isotype control staining) versus CD3 were derived from gated events with the forward and side light-scatter characteristics of intact lymphocytes. Flow cytometric analysis was performed using a BD LSRFortessa™ Cell Analyzer System.


 全部商品分类


 下载产品说明书
 用小程序,查商品更便捷


 收藏
收藏
 对比
对比 咨询
咨询