


 全部商品分类


MCHERRY RAT MONOCLONALANTIBODY

 下载产品说明书 下载COA 下载SDS
 用小程序,查商品更便捷


 收藏
收藏
 对比
对比 咨询
咨询种属反应
已发表种属
宿主/亚型
分类
类型
克隆号
抗原
偶联物
形式
浓度
纯化类型
保存液
内含物
保存条件
运输条件
RRID
靶标信息
MCherry is a fluorophore (a fluorescent molecule) used in biotechnology as a tracer to follow the flow of fluids, as a marker when tagged to molecules and cells components. mCherry is a monomeric fluorescent construct which absorbs at 587 nm and emits at 610 nm. It is resistant to photobleaching and is stable. It matures quickly, with a t 0. 5 of 15 minutes, allowing it to be visualized soon after translation.
仅用于科研。不用于诊断过程。未经明确授权不得转售。
生物信息学
蛋白别名: mCherry
参考图片
Immunofluorescent analysis of mCherry Tag was performed using 70% confluent mCherry-H3 transfected HEK-293 cells. The cells were fixed with 4% paraformaldehyde for 10 minutes, permeabilized with 0.1% Triton™ X-100 for 15 minutes, and blocked with 2% BSA for 1 hour at room temperature. The cells were labeled with mCherry Monoclonal Antibody (16D7) (Product # M11217) at 5 µg/mL and Histone H3 Recombinant Polyclonal Antibody (Product # 711055) at 0.5 µg/mL in 0.1% BSA, incubated at 4°C overnight and then labeled with Goat anti-Rat IgG (H+L) Cross-Adsorbed Secondary Antibody, Alexa Fluor 488 (Product # A-11006) and Goat anti-Rabbit IgG (H+L) Highly Cross-Adsorbed Secondary Antibody, Alexa Fluor Plus 647 (Product # A32733) respectively at a dilution of 1:2000 for 45 minutes at room temperature. Panel a (Nuclei: Green) represents mCherry Tag. Panel b (Nuclei: Red) represents Histone H3. Panel c (Nuclei: Blue) represents ProLong™ Diamond Antifade Mountant with DAPI (Product # P36962). Panel d represents the merged image showing the co-localization of nuclear signals in transfected cells. Panel e represents untransfected HEK-293 cells. Panel f represents control cells with no primary antibody to assess background. The images were captured at 60X magnification.
U2OS cells were transduced using an adenoviral construct expressing mCherry. A) Native expression of mCherry detected post-transduction using Texas Red filters (562 nm/624 nm) B) Anti-Cherry antibody added and cells imaged using the Cy5 filter set (628 nm/692 nm) C) mCherry expression detected by adding anti-mCherry and Alexa Fluor® 647 goat anti-rat (Product # A-21247)
Intestinal tissue from a transgenic mouse expressing mCherry in all tissues was isolated and fixed in 4% paraformaldehyde. mCherry Rat Monoclonal Antibody (M11217) was used at a 1:15,000 dilution. Using the ImmPRESS™ Anti-Rat Ig (peroxidase) Polymer Detection Kit (Vector Laboratories) and following the manufacturer’s instructions, the sections were incubated in peroxidase substrate solution until the desired stain intensity developed. A) Fluorescent image detecting mCherry expression and B) HRP-stained image.
Intestinal tissue from a transgenic mouse expressing mCherry in all tissues was isolated and fixed in 4% paraformaldehyde. mCherry Rat Monoclonal Antibody (M11217) was used at a 1:15,000 dilution. Using the ImmPRESS™ Anti-Rat Ig (peroxidase) Polymer Detection Kit (Vector Laboratories) and following the manufacturer’s instructions, the sections were incubated in peroxidase substrate solution until the desired stain intensity developed. A) Bright field image, B) HRP-stained image.
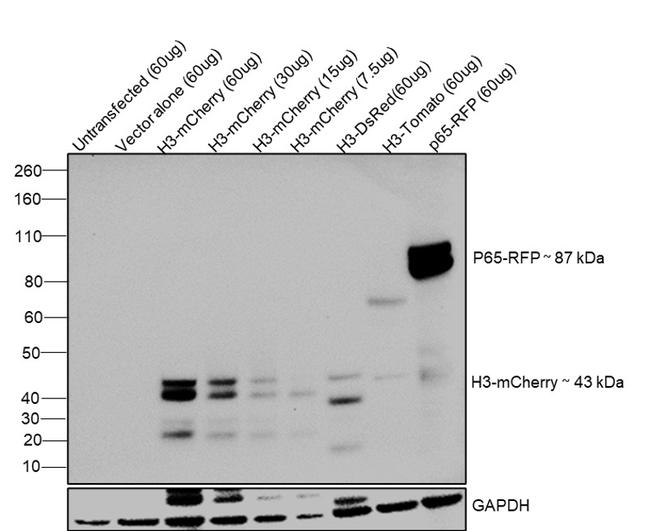
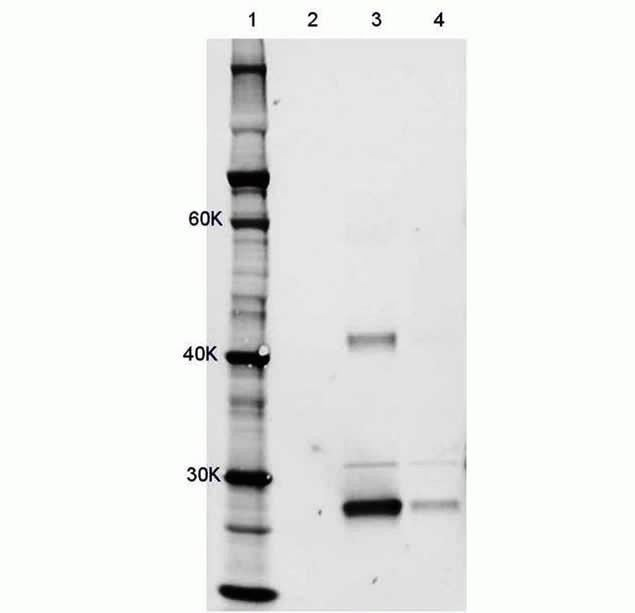
Western blot was performed using: mCherry Monoclonal Antibody (16D7) (Product # M11217) by loading whole cell extracts of untransfected and transiently transfected HEK-293E lysates: untransfected, 60 µg (Lane 1), empty vector control, 60 µg (Lane 2), H3-mCherry, 60 µg (Lane 3), H3-mCherry, 30 µg (Lane 4), H3-mCherry, 15 µg (Lane 5), H3-mCherry, 7.5 µg (Lane 6), H3-DsRed, 60 µg (Lane 7), H3-dTomato, 60 µg (Lane 8) and p65-RFP, 60 µg (Lane 9) were electrophoresed using NuPAGE™ 4-12% Bis-Tris Protein Gel (Product # NP0322BOX). Resolved proteins were then transferred onto a nitrocellulose membrane (Product # IB23001) by iBlot® 2 Dry Blotting System (Product # IB21001). A ~43 kDa band corresponding to H3-mCherry and 87 kDa band corresponding to p65-RFP were observed in HEK293E transfected lysates on probing with the primary antibody (1 µg/mL) and detected by chemiluminescence with F(ab')2-Rabbit anti-Rat IgG (H+L) Secondary Antibody, HRP (Product # PA1-29927, 1:4000 dilution) using the iBright FL 1500 (Product # A44241).
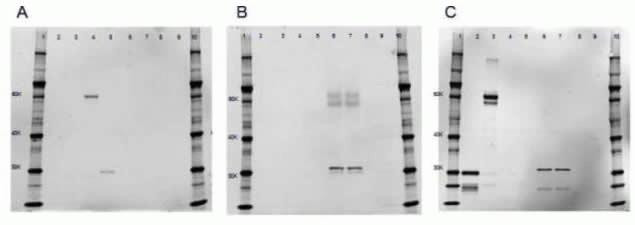
After transfer of the proteins, the nitrocellulose membranes were probed with either (A) rabbit anti-GFP (Product # A-11122) and secondary antibody Alexa Fluor® 647 Goat Anti-Rabbit (Product # A-21245), (B) rat anti-mCherry (M11217) and secondary antibody Alexa Fluor® 647 Goat Anti-Rat (Product # A-21247) or (C) rabbit anti-RFP (Product # R10367) and secondary antibody Alexa Fluor® 647 Goat Anti-Rabbit (Product # A-21245). Lanes 1 and 10: Novex® Sharp Pre-Stained Protein Standards (LC5800). Lane 2: 20 µg of U2OS cell lysate expressing plasma membrane targeted TagRFP. Lane 3: mKate RFP-P62 fusion protein. Lane 4: TagGFP-P62 fusion protein. Lane 5: plasma membrane targeted Emerald GFP. Lanes 6 & 7: untargeted mCherry. Lanes 8 & 9: control. The anti-mCherry antibody is specific for mCherry protein and does not cross-react with either GFP or RFP.
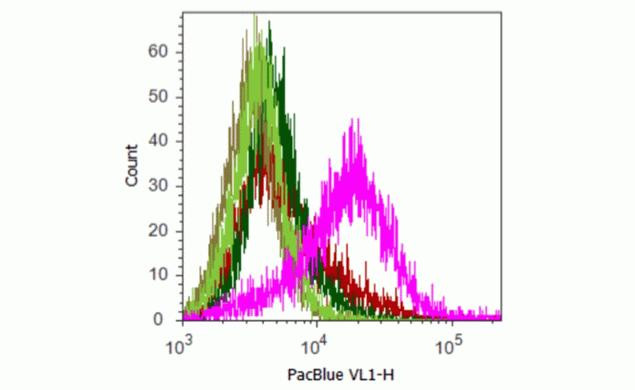
U2OS cells were transduced with plasma membrane targeted-GFP (light green line), emerald GFP (dark green line), plasma membrane targeted-TagRFP (purple line), P62-mKate (red line), or mCherry (pink line). After trypsinization, cells were fixed and permeablized. They were then blocked with normal rat IgG and labeled with 1 µg of a direct conjugate of anti-mCherry-PacificBlue™. Untransduced cells stained with antibody served as a negative control. All proteins were expressed, as determined by microscopy (data not shown).
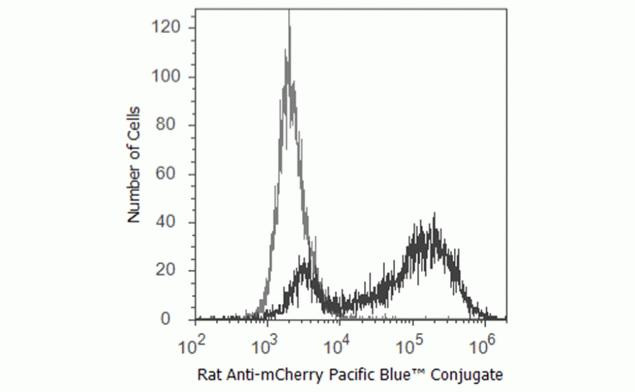
U20S cells expressing mCherry were analyzed using 405 nm excitation and 450/40 nm band pass emission on an Attune® Acoustic Focusing Cytometer. The histogram shows cells stained with mCherry rat monoclonal antibody conjugated with Pacific Blue™ (black line) and unstained cells (gray line).
Hela cells were transduced with adenovirus-mCherry using the Novex® Immunoprecipitation Kit Dynabeads Protein G (Product # 10007D). Samples were analyzed by SDS-PAGE using a NuPAGE® 4-12% Bis-Tris Gel. Samples were transferred to nitrocellulose membrane using the iBLOT® Transfer Device. Rat anti-mCherry antibody was used at 1:1000 dilution with goat anti-rat Alexa Fluor® 647 secondary at 1:1000 dilution to detect mCherry in the cell lysate samples. The anti-mCherry antibody detected mCherry expression (bands at ~30K and ~24K). The 30K band is intact mCherry, while the 24K band represents the mCherry degradation product.Lane 1: Novex® Sharp Pre-Stained Protein Standards (LC5800). Lane 2: 20 µg U2OS control lysate. Lane 3: 100 ng immunopreciptated purified Hela lysate. Lane 4: 40 µg HeLa lysate supernatant from IPP purification.
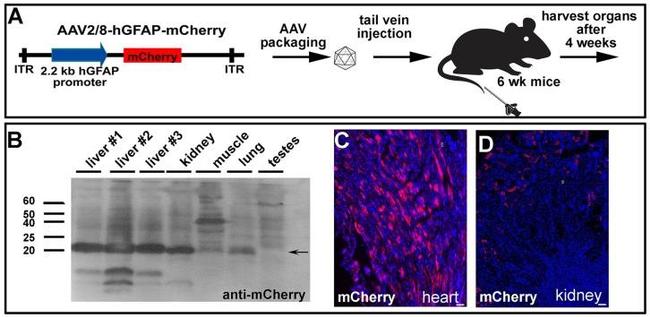
Systemically injected AAV2/8-GFAP-mCherry is trapped and expressed in peripheral organs. (A) Experimental procedure, showing AAV2/8-GFAP-mCherry construct and tail vein injection in 6 week old mice. (B) Western blot of lysed organs with an anti-mCherry antibody, confirming expression of this fluorescent protein in liver, kidney and lung 4 weeks post injection. (C) mCherry epifluorescence in the heart (C) and kidney (D). (Scale bars =25 mum).
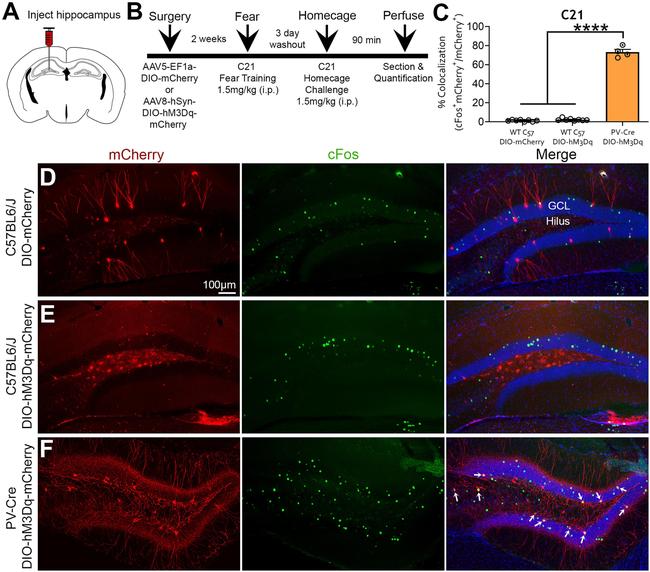
Figure 8. mCherry and c-Fos immunofluorescence following C21 home-cage challenge. A , B , Experimental design and timeline. Mice underwent surgery for AAV injection and were allowed 2 weeks for recovery. Mice underwent behavioral testing and were then given a 3 d washout period. Mice were then injected with C21 (1.5 mg/kg) in their home cage and were euthanized 90 min later to evaluate the immediate early gene c-Fos. C , The percentage of colocalization of c-Fos + and mCherry + cells following C21 challenge was significantly lower in C57BL/6J mice injected with DIO-mCherry (7 c-Fos + mCherry + /497 mCherry + cells = 1.41%) or DIO-hM3Dq-mCherry (23 c-Fos + mCherry + /1062 mCherry + cells = 2.17%) compared with PV-Cre + mice injected with DIO-hM3Dq-mCherry (267 c-Fos + mCherry/367 mCherry + cells = 72.75%). D-F , Representative images show that C57BL/6J mice lacked the clear elevation of c-Fos (green) in mCherry + cells seen in PV-Cre + mice (yellow; white arrows). **** p < 0.0001. Scale bar, 100 mum.
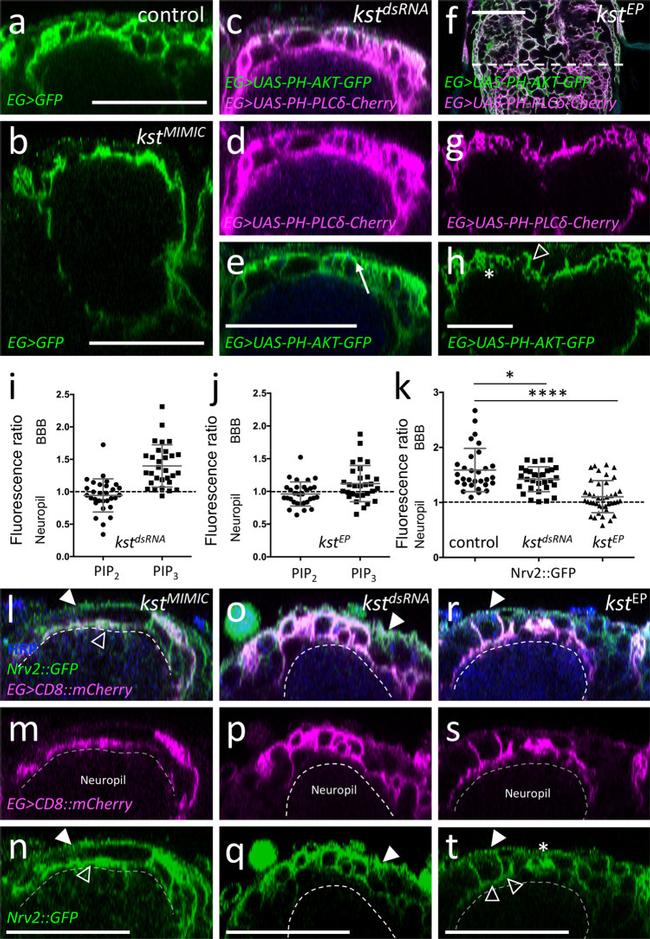
Fig. 9 The ss H -Spectrin cytoskeleton is required for glial polarity. Representative images are shown. a Orthogonal view of the dorsal aspect of a third instar control ventral nerve cord stained for ensheathing glial (EG) morphology [ 83E12-Gal4, UAS-CD8::GFP ]. b Third instar larval brain of a zygotic karst null mutant larvae with the genotype [ kst MiMIC13613 / kst MiMIC13613 , 83E12-Gal4, UAS-CD8::GFP ]. The absence of all ss H -Spectrin protein affects the morphology of the dorsally located ensheathing glial cells. c - e Third instar larval ventral nerve cord with reduced kst expression in ensheathing glia [ 83E12-Gal4, UAS-kst dsRNA , UAS-PH-AKT-GFP, UAS-PH-PLCdelta-Cherry ]. d PH-PLCdelta-Cherry binds to PIP 2 and shows an even distribution between apical and basolateral plasma membrane domains. For quantification see ( i ). Quantification was performed as described in Fig. 6 . e PH-AKT-GFP binds to PIP 3 and is distributed in a polarized manner. For quantification see ( i ). f - h Third instar larval ventral nerve cord with increased kst expression in ensheathing glia [ 83E12-Gal4, kst P{EPgy2}EY01010 , UAS-PH-AKT-GFP, UAS-PH-PLCdelta-Cherry ]. Note, the variable phenotype noted upon karst overexpression. Ensheathing glia with almost normal morphology (open arrowhead) is next to hyperconvoluted ensheathing glia (asterisk). Quantification of PIP 2 and PIP 3 localization is shown in ( j ). i , j Quantification was performed as described in Fig. 6 . The mean and the stan
Fig. 8 ss H -Spectrin shows a polar distribution in ensheathing glia. Representative images are shown. a Schematic view of the karst locus. Transcription is from left to right. Seven different karst mRNAs are generated from two promoters (P1, P2) as indicated ( kst-RA - RH ). The ss H -Spectrin proteins PE and PG differ in a C-terminal exon indicated by brackets. The position of two MiMIC insertions and the EP insertion used for gain of function experiments is indicated, the blues line denotes the position of the peptide used for immunization. b Confocal view of the surface of a third larval instar brain of a kst MiMIC03134::GFP animal that expresses mCherry in all ensheathing glia [ 83E12-Gal4, UAS-CD8::mCherry ]. The dashed line indicates the position of the orthogonal view shown in ( c , d ). Expression at the blood-brain barrier forming subperineurial glia (arrows) and at the apical domain of the ensheathing glia (arrowheads) can be detected. For quantification see ( k ). e Similar view as shown in ( b ) of a control larva stained for Kst expression using a polyclonal antiserum. The dashed line indicates the position of the orthogonal view shown in ( f ). f Localization of Kst protein is weakly seen in the blood-brain barrier (arrow) and the ensheathing glia (arrowhead). g Orthogonal view of a kst MiMIC03134::GFP animal expressing kst dsRNA in the ensheathing glia (EG) [ 83E12-Gal4, UAS-kst dsRNA ]. Expression of Karst in ensheathing glia cannot be detected anymore (aster
Fig. 6 Ensheathing glial cells show polarized plasma membrane domains. Representative images are shown. a Projection of a confocal stack of a third instar larval ventral nerve cord coexpressing PH-AKT-GFP and PH-PLCdelta-mCherry in ensheathing glial cells (EG) [ 83E12-Gal4, UAS-PH-AKT-GFP, UAS - PH-PLCdelta-mCherry ]. The dashed white line indicates the position of the orthogonal section shown in ( b ). b Orthogonal section showing the dorsal aspect of the neuropil. The boxed area is shown in higher magnification in ( c - e ). The dashed areas were subsequently used for quantification of GFP and mCherry localization. f Quantification of GFP/mCherry distribution in larval and adult ensheathing glia. The ratio of red (PLCdelta-mCherry shown in magenta) and green (PH-AKT-GFP) fluorescent pixels of the areas indicated in ( c ) is plotted. The mean and standard deviation is shown. g Schematic view of a dorsal ensheathing glial cell. The neuropil facing domain is characterized by a high PIP 2 content, whereas PIP 3 is concentrated on the baso-lateral domain, where Nrv2 is predominantly localized, too. The blue dot indicates the position of a neuron. h Coexpression of Nrv2::GFP and 83E12-Gal4, UAS-mCherry in the ventral nerve cord of third instar larva. The boxed area is shown in higher magnification in ( i , j ). Note the preferential localization of Nrv2 at the basolateral cell domain of the ensheathing glia (arrows). Only little Nrv2 is found at the apical domain (open arrow head
Fig. 1 Development of ensheathing glia. Representative images are shown. a - d Dissected larval CNS of increasing age with the genotype [ 83E12-Gal4, UAS-CD8::GFP ], stained for GFP (green), Repo (magenta) and neuronal membranes (anti-HRP, blue), anterior is up. The positions of the orthogonal section shown in a '- d ' is indicated by a dashed line. a , a ' In a stage 16 embryo ensheathing glial cells have not yet covered the neuropil (arrowheads). b , b ' First instar larval CNS. c , c ' Second instar larval CNS. d , d ' CNS of a wandering third instar larva. The arrows point towards dorsal protrusions of the ensheathing glia engulfing dorsal neurons. e MCFO labeling of ensheathing glia in third instar larva stained for the expression of V5 (green), HA (red), and FLAG and OLLAS epitopes (blue). flp expression was induced for one hour during first instar larval stage. Note that ensheathing glia tile the ventral nerve cord. f Two distinct ensheathing/wrapping glia cells cover the nerve root and part of the neuropil (arrowheads). g Ensheathing glia occupy specific territories in the neuropil. h , i Third instar larval nerve cord with the genotype [ 55B12-Gal4, 83E12-LexA, UAS-CD8::mCherry, LexAop-GFP ]. All cortex glia cells are labelled by mCherry expression (magenta). Ensheathing glial cells are labelled by GFP expression (green). The dashed line indicates the position of the orthogonal view shown in ( i ). j Schematic view on a cross section through a hemineuromere indicatin
Stage-specific causal role of ERRgamma in regulating TNNI3-driven cardiac maturation. a Fluorescence images of ERRgammaKO hiPSC-CMs treated with DMSO, T112, or T623 for TNNI1 EmGFP and TNNI3 mCherry expression. Scale bars: 500 mum. b Flow cytometric analysis of day-16 CMs derived from ERRgammaKO hiPSCs for TNNI3 mCherry expression. n = 4 independent experiments per group. Data are the mean +- SEM; Statistical analysis was compared to DMSO using one-way ANOVA followed by Dunnett's test. NT no treatment. c Mitochondrial respiration rates of ERRgammaKO hiPSC-CMs treated with either DMSO or T112 (O Oligomycin ; F FCCP, phenylhydrazone ; AR Antimycin A and Rotenone ). n = 5 biologically independent samples per group. d Basal and maximal OCR and ATP production of ERRgammaKO hiPSC-CMs treated with either DMSO or T112. Statistical analysis was done using unpaired two-tailed t -tests. n = 5 biologically independent samples per group. Data are the mean +- SEM; Statistical analysis was using unpaired two-tailed t -test.
FIGURE 1: pHLARE localizes to lysosomes. (A) Schematic of pHLARE with rat LAMP1 tagged at the lumenal amino-terminus with sfGFP and at the cytoplasmic carboxyl-terminus with mCherry. (B) pHLARE stably expressed in human RPE cells, visualized with anti-mCherry antibodies, colocalizes with endogenous LAMP1, visualized with anti-human LAMP1 antibodies. (C) Fluorescence ratios of pHLARE in RPE cells in nigericin-containing buffers between pH 4.0 and 7.0. Data are means +- SEM of 15 cells from three separate cell preparations. Statistical analysis by Tukey-Kramer HSD indicates significant differences at all pH values except between pH 6.5 and 7.0. (D) Representative RFP immunoblot of three preparations of lysates from RPE cells, WT, and stably expressing pHLARE and untreated or treated with nigericin buffer at the indicated pH values for 5 min. The asterisks indicate nonspecific bands seen also in RPE WT cells not expressing pHLARE and GAPDH is used as a loading control. (E) Images of live RPE cells stably expressing pHLARE and stained with SiR-lysosome, a far-red pepstatin A that binds cathepsin D. The magenta outline in the insets at higher magnification indicate lysosomes detected in the SiR-lysosome channel showing overlap with pHLARE. (F) Analysis of the amount of pHLARE fluorescence signal associated with SiR-lysosome objects. As expected, the fluorescence distribution in the mCherry channel is insensitive to pH equilibration, while the SiR lysosome-associated sfGFP fluoresc
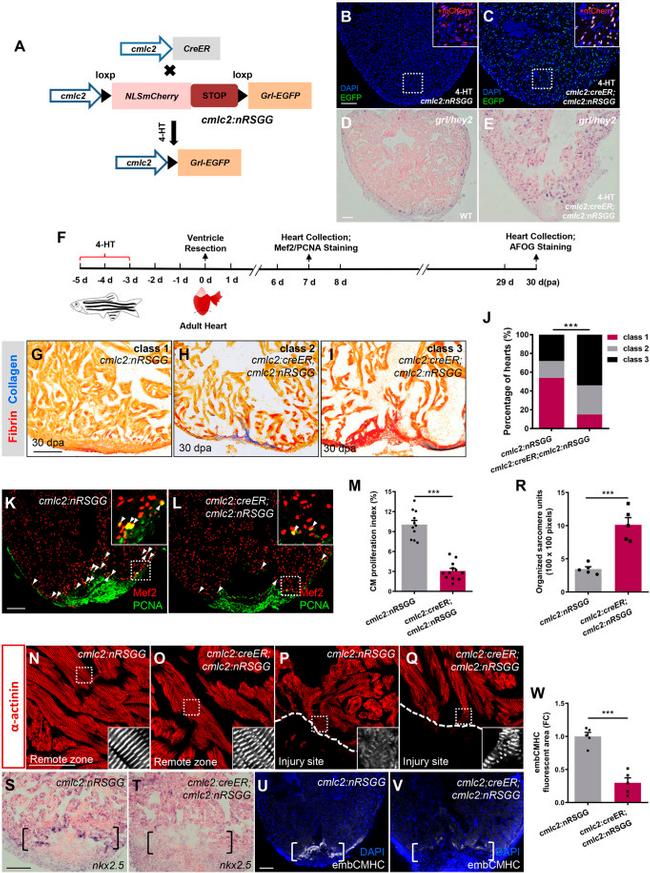
Fig. 3. Conditional grl induction in the adult myocardium impairs CM dedifferentiation and proliferation during regeneration. (A) Transgenic zebrafish used for inducible expression of Grl-EGFP in CMs. Tg(cmlc2:nRSGG) zebrafish were crossed with Tg(cmlc2:CreER) animals, which permitted Cre-mediated recombination to induce Grl in CMs after 5 uM 4-HT treatment. (B,C) Grl was induced in CMs of 4-HT-treated Tg(cmlc2:creER;cmlc2:nRSGG) hearts (C) but not Tg(cmlc2:nRSGG) hearts (B), as indicated by EGFP protein (green). Insets show higher-magnification images of the dashed boxes adding mCherry channel (red). (D,E) ISH analyses indicate the endogenous expression of grl in WT hearts (D) and the induced expression of grl in CMs of the whole ventricle in 4-HT-treated Tg(cmlc2:creER;cmlc2:nRSGG) animals (E) at 7 dpa. (F) Experimental design for PCNA and Mef2 immunostaining and fibrotic scar (AFOG) analysis after ventricular resection. 4-HT treatment was 5 uM 4-HT for bath treatment for 2 days. (G-I) Section images of 30 dpa ventricles of 4-HT-treated Tg(cmlc2:nRSGG) control fish (G) and 4-HT-treated Tg(cmlc2:creER;cmlc2:nRSGG) animals (H,I) stained with AFOG (blue for collagen, red for fibrin). Heart sections were scored as ''class 1'', ''class 2'' or ''class 3'' according to the criteria described in Materials and Methods. (J) Quantification of regenerative status of ventricles in 4-HT-treated Tg(cmlc2:creER;cmlc2:nRSGG) ( n =6; 129 sections) and Tg(cmlc2:nRSGG) control group ( n =4; 84
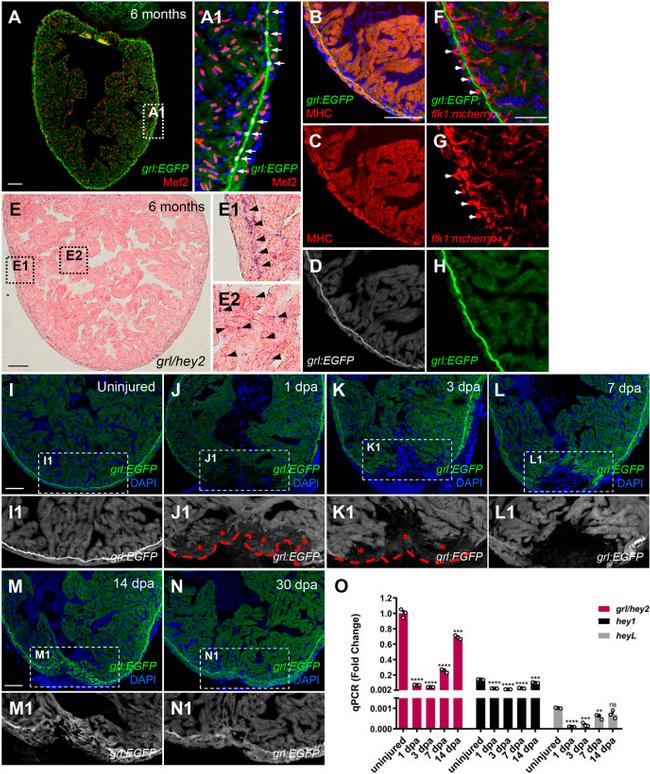
Fig. 1. Reduction of myocardial grl correlates with regenerative responses of the zebrafish heart to injury. (A-D) grl :EGFP (green or white) overlaps with a nuclear CM marker Mef2 (red) (A) and a cytoplasmic CM marker MHC (red) (B-D). (A1) Enlarged image of the dashed box in A. Arrows indicate the grl -enriched primordial layer (PML). (E) ISH for grl displays enriched expression in the PML and its expression throughout the myocardium in adult zebrafish hearts. (E1) Higher-magnification image of the dashed box in E; arrowheads point to the grl -enriched PML. (E2) Enlarged image of the dashed box in E; arrowheads point to grl expression in the myocardium. (F-H) grl :EGFP (green) does not colocalize with endocardial or coronary endothelial cells marked by flk1: mCherry (red) in adult Tg(grl:EGFP;flk1:mCherry) hearts. Arrows indicate the circular coronary vessels. (I-N) Tg(grl: EGFP ) adult heart show grl :EGFP (green) expression in uninjured and regenerating ventricles. (I1-N1) Higher-magnification images of the dashed boxes in I-N. Red dashed line indicates approximate plane of resection. Red asterisks mark decreased expression of grl :EGFP in the injury border zone. (O) Expression of grl , hey1 , and heyL were examined using qPCR analyses in uninjured and regeneration ventricular samples. Expression levels were normalized to that of beta-actin and further normalized to that of grl in uninjured sample ( n =3). Data presents as mean+-s.e.m. ** P <0.01, *** P <0.001, **** P <0.0
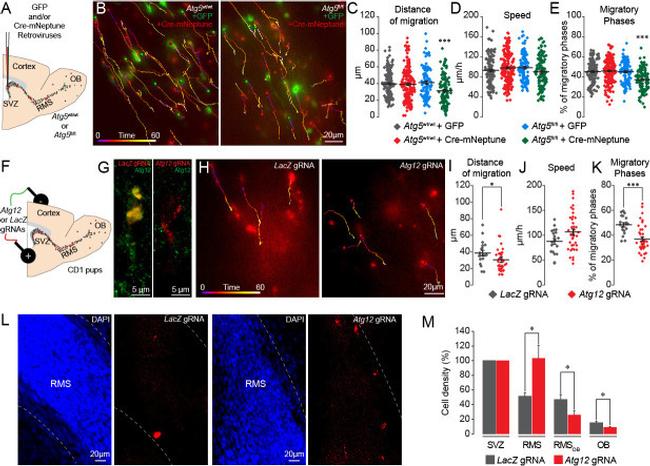
Figure 3. Genetic impairment of autophagy-related genes in the adult and early postnatal mice disrupts cell migration. ( A ) Experimental procedure for GFP- and Cre-mNeptune-encoding retroviral labeling of neuroblasts from Atg5 wt/wt and Atg5 fl/fl mice. ( B ) Example of time-lapse imaging of neuroblasts expressing GFP or Cre-mNeptune. ( C-E ) Distance of migration, speed of migration, and percentage of migratory phases for Atg5 wt/wt and Atg5 fl/fl mice injected with GFP or Cre-mNeptune retroviruses. Atg5 wt/wt -GFP (n = 143 cells from eight mice), Atg5 wt/wt -Cre-mNeptune (n = 208 cells from nine mice), Atg5 fl/fl -GFP (n = 106 cells from seven mice), and Atg5 fl/fl -Cre-mNeptune (n = 121 cells from five mice). ***p<0.001 with a one-way ANOVA followed by an LSD-Fisher post hoc test. ( F ) Experimental procedure for the electroporation of plasmids expressing Cas9-T2A-mCherry and gRNAs. Plasmids were injected into the lateral ventricle of P1-P2 pups followed by the application of electrical pulses. Acute sections were prepared 8-13 days post-electroporation, and the migration of electroporated cells was assessed by time-lapse imaging. ( G ) Example of immunostaining of Atg12 on cells expressing LacZ gRNA (green) and Atg12 gRNA (red). ( H ) Time-lapse imaging of neuroblasts electroporated with LacZ gRNA or Atg12 gRNA in acute brain sections. ( I-K ) Distance of migration, speed of migration, and percentage of migratory phases of cells electroporated with LacZ gRNA or Atg12 gRN
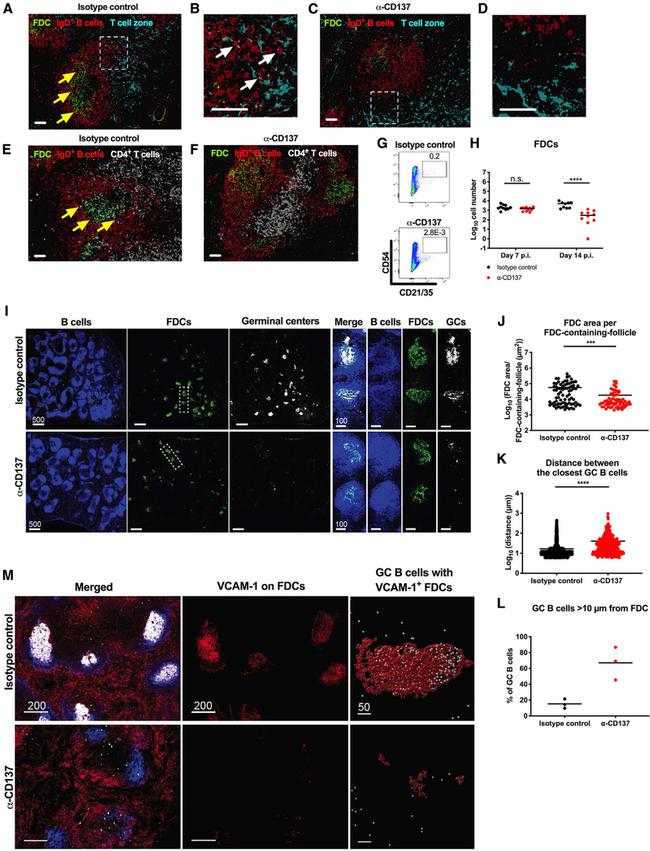
Figure 4. Anti-CD137 mAb Results in Disorganization of B Cell Follicle Architecture in the Spleen Four-week-old WT C57BL/6 male mice were inoculated with 10 3 FFU of CHIKV. At 2 dpi, 400 mug of agonistic anti-CD137 or isotype control mAb was administered by an i.p. route. Spleens were harvested at 6 dpi (A-D), 7 dpi (E and F), and 14 dpi (I-M) for imaging. (A-D) FDCs (green) were stained for CD21/35; IgD + B cells (red); and T cell zone (turquoise), CCL21. (B and D) Insets of the respective dotted boxes. (E and F) FDCs (green) were stained for CD21/35; IgD + B cells (red); and CD4 + T cells (snow). White scale bars indicate 50 mum. Yellow arrows indicate IgD + B cells surrounding FDCs, and white arrows indicate IgD + B cells at the CCL21 + T cell zone border. (G and H) The number of CD45 - CD21/35 + CD54 + FDCs in the spleen at 7 and 14 dpi was analyzed by flow cytometry. (G) Representative flow cytometry dot plots of FDCs are shown. (I) B cells (blue) were stained for B220; FDCs (green), CD21/35; and GC B cells (snow), GL7. White scale bars indicate 500 mum or 100 mum (insets). Each symbol represents an individual FDC-containing follicle (J), GC B cell (K), or spleen (L), and bars indicate mean values. Quantification was performed for FDC area per FDC-containing-follicle (J), distance between the closest GC B cells (K), and GC B cells greater than 10 mum from an FDC (L). (M) Left and middle: FDCs (blue) were stained for CD21/35; VCAM-1 (red); merge (white). (M) Right: GC B c
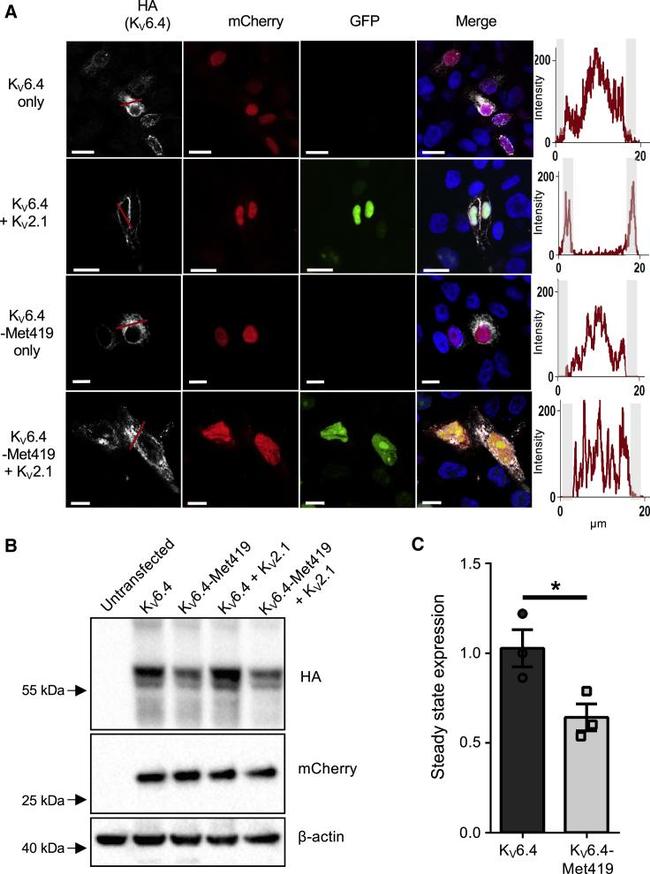
Figure 2 p.Val419Met Blocks K V 6.4 from Reaching the Plasma Membrane Independent of Changes in Steady-State Expression (A) Immunofluorescence analysis of K V 6.4 localization. In the absence of K V 2.1, K V 6.4 was retained in the cytoplasm (white channel, top panel) and trafficked to the cell membrane in the presence of K V 2.1 (white channel, second row). In contrast, HA-tagged K V 6.4-Met419 did not localize to the cell membrane in the absence or presence of K V 2.1 expression (white channels in the third and fourth rows). Expression of K V 2.1 is demonstrated by the presence or absence of green nuclei, expression of K V 6.4 is displayed directly by HA tag in the white channel, and expression of the IRES vector expressing K V 6.4 is displayed by the presence of the mCherry signal in the red channel. Graphs adjacent to each row display the intensity of the K V 6.4 HA signal along the red line in each respective white channel; note membrane-localized peaks only in K V 6.4 when co-expressed with K V 2.1. Scale bars indicate 10 mum. (B) HA-tagged K V 6.4 was transiently expressed in the presence or absence of K V 2.1. There was a modest reduction in steady-state stability for K V 6.4-Met419 compared with K V 6.4. (C) Stability as assessed by densitometry of HA compared with mCherry as a control of transfection efficiency. Error bars indicate standard error. Unpaired t test (*p = 0.04).
Figure 4. Chemogenetic Inhibition of CeA-PKCdelta Cells Reverses Nerve-Injury-Induced Tactile and Thermal Hypersensitivity, while Chemogenetic Excitation Induces Tactile Hypersensitivity (A) A schematic of the experimental approach. Prkcd -Cre mice were stereotaxically injected with AAV-DIO-hM4Di-mCherry, AAV-DIO-hM3Dq-mCherry, or AAV-DIO-mCherry into the amygdala. Current-clamp recordings were obtained from mCherry-CeA-positive cells in acute amygdala slices 2 weeks after the injection. (B) Representative low- (left) and high-magnification (right) images of a coronal mouse brain slice from a Prkcd -Cre mouse injected with AAV-DIO-hM4Di-mCherry into the CeA. The green fluorescent channel is overexposed to facilitate visualization of the anatomical landmarks. The white box depicts the area in the magnified image on the right panel. Mean +- SEM number of mCherry-transduced and PKCdelta IF-positive cells is shown in the right panel (n = 19 mice for the transduced cells and 6 mice for the PKCdelta-IF cells). Scale bars represent 1,000 mum (left panel) and 100 mum (right panel). (C) Representative bright-field (top) and fluorescent (bottom) images of an acute amygdala slice obtained from a Prkcd -Cre mouse stereotaxically injected with AAV-DIO-hM4Di-mCherry are shown at the bottom. Inset shows a magnified view of transduced cells, denoted with the solid arrowheads. Scale bars represent 200 mum (main panels) and 10 mum (inset). (D) Representative traces of whole-cell current-clamp
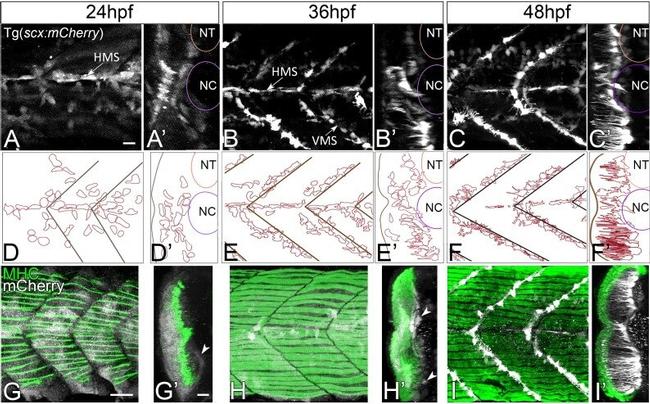
Figure 1. Axial tenocyte morphogenesis. ( A-C ) Lateral views of live Tg( scx:mCherry ) embryos showing developing tenocytes (A - 24 hpf, B - 36 hpf, C - 48 hpf). ( A'-C' ) Transverse views from 3D projections showing the positions of developing tenocytes in relation to the notochord (NC) and neural tube (NT) along the horizontal (HMS) and vertical myosepta (VMS) (arrows). Tenocytes form projections at 36-48 hpf ( B' and C' ). ( D-F ) Diagrams of lateral views showing the morphology of tenocytes in the developing somites. ( D'-F' ) Diagrams of transverse views from 3D projections of live Tg( scx:mCherry ) embryos show the development of tenocyte projections ( E' and F' ). ( G-I ) Lateral views of co-immunostained Tg( scx:mCherry ) embryos showing developing tenocytes (anti-mCherry - white) and muscle fibers (anti-MHC - green) (G - 24 hpf, H - 36 hpf, I - 48 hpf). ( G'-I' ) Transverse views from 3D projections of live Tg( scx:mCherry ) embryos showing the positions of developing tenocytes (arrowheads in G' and H') in relation to the myotome. Scale bars = 20 microns. Figure 1--figure supplement 1. Axial tenocytes form polarized projections orthogonal to muscle fibers. ( A ) Lateral and ( B ) transverse views of live 60 hpf Tg( scx:mCherry ) embryos showing tenocytes, which are pseudocolored to highlight the depth of the 3D reconstructed image. Transgene expression is also observed in neuronal cell bodies in the neural tube. Scale bars = 10 microns. Figu
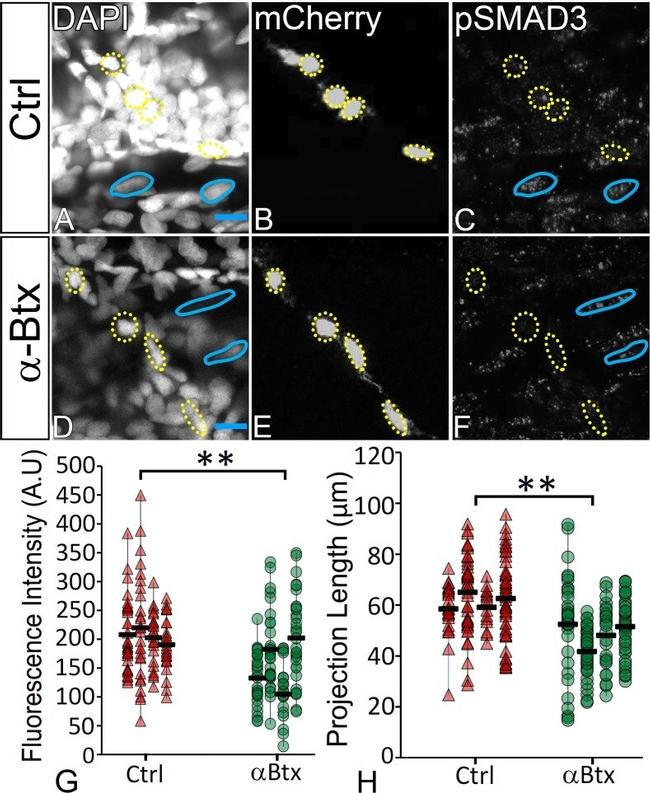
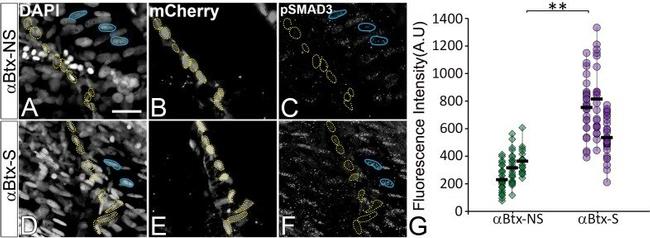
Figure 6. TGFbeta signaling in tenocytes requires mechanical force. Lateral views of 48 hpf immunostained Tg( scx:mCherry ) control ( A-C ) and alphaBtx injected ( D-F ) embryos showing nuclei (DAPI), tenocytes (anti-mCherry) and pSMAD3 (anti-pSMAD3) (marked by yellow-dotted ROI). ( G ) Localization of pSMAD3 was quantified as fluorescent intensity of nuclear pSMAD3 signal and plotted as a dot plot (n = 4, p value was calculated by t-test **<0.005). ( H ) Dot plot shows individual tenocyte projection lengths (p value was calculated by t-test **<0.00005). Representative muscle nuclei are marked by a blue continuous ROI. Scale bar = 10 microns. The measurements used for quantitative analysis and creation of the plots can be accessed from Figure 6--source data 1 and Figure 6--source data 2 . Figure 6--source data 1. Measurements of Tenocyte projection length along VMS. Figure 6--source data 2. Measurements of tenocyte nuclei pSMAD3 fluorescence intensity along VMS. Figure 6--figure supplement 1. TGFbeta signaling is elevated in response to mechanical force. ( A-F ) Single plane images showing lateral views of paralyzed (alphaBtx) 48 hpf embryos without stimulation ( A-C ) and after stimulation ( D-F ), immunostained to show nuclei (DAPI), tenocytes (anti-mCherry) and pSMAD3 (anti-pSMAD3) (marked by yellow dotted ROI). Cell bodies are outlined by dotted lines. ( G ) pSMAD3 localization was quantified as fluorescent intensity of nuclear p
Figure 6--figure supplement 1. TGFbeta signaling is elevated in response to mechanical force. ( A-F ) Single plane images showing lateral views of paralyzed (alphaBtx) 48 hpf embryos without stimulation ( A-C ) and after stimulation ( D-F ), immunostained to show nuclei (DAPI), tenocytes (anti-mCherry) and pSMAD3 (anti-pSMAD3) (marked by yellow dotted ROI). Cell bodies are outlined by dotted lines. ( G ) pSMAD3 localization was quantified as fluorescent intensity of nuclear pSMAD3 signal and plotted as a dot plot (n = 3, p value was calculated by Wilcoxon Rank Sum test **<0.0005). NS - Not Stimulated, S - Stimulated. Representative muscle nuclei are marked by a blue continuous ROB. Scale bar = 10 microns. The measurements used for quantitative analysis and creation of the plots can be accessed from Figure 6--figure supplement 1--source data 1 . Figure 6--figure supplement 1--source data 1. Measurements of tenocyte nuclei pSMAD3 fluorescence intensity along VMS.
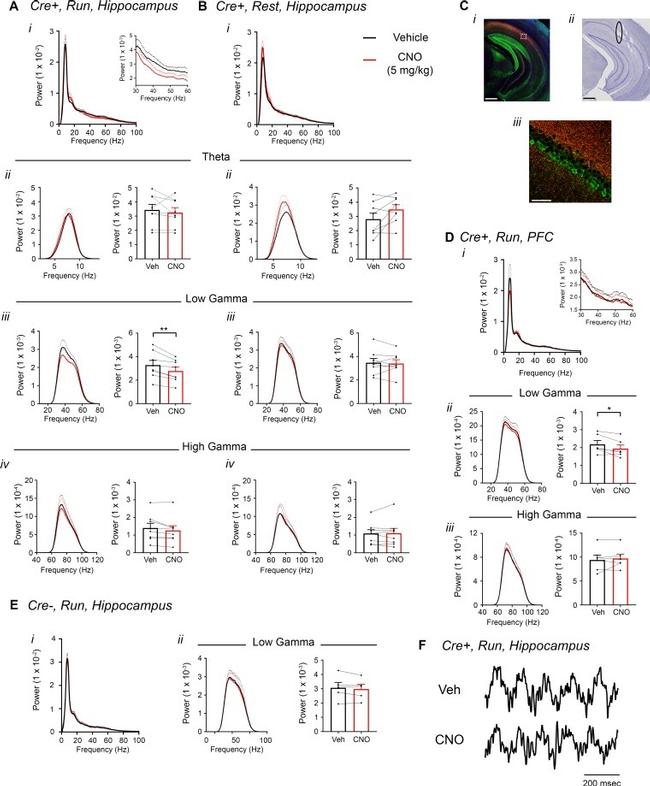
Figure 5. Inhibition of CA2 pyramidal cells with hM4Di decreases hippocampal and PFC low-gamma power. ( A-B ) Hippocampal LFP power measures from Amigo2- icreERT2+ mice infused with hM4Di AAV and treated with vehicle or CNO (5 mg/kg, SQ; LFP samples 30 - 60 min following treatment) during periods of running ( A ) and resting ( B ). For each of A and B: ( i ) Power spectral density plots from raw LFPs for frequencies up to 100 Hz. Inset plot in A i is expanded from A i . ( ii-iv ) Power spectral density plots and peak power measured in the theta (5 - 10 Hz; ii ), low-gamma (30 - 60 Hz; iii ) or high-gamma (65 - 100 Hz; iv ) frequency ranges. In A ii-iv and B ii-iv , plots on the left show power spectral density for the listed frequency bands, and plots on the right show mean peak power for the population of animals in colored bars according to treatment and dots representing data from individual animals. ( A iii ) CNO administration produced a significant decrease in hippocampal low-gamma power during running (N = 8 mice (four female, four male); t(7) = 4.408, p = 0.0031, two-tailed paired t-test). CNO treatment did not affect theta power during running (t(7) = 0.7786, p = 0.4617; A ii ), high-gamma power during running (t(7) = 2.029, p = 0.0821; A iv ), theta power during rest (t(7) = 2.214, p = 0.0625; B ii ), low-gamma power during rest (t(7) = 0.4522, p = 0.6648; B iii ) or high-gamma power during rest (t(7) = 0.172, p = 0.8683; B iv ). ( C ) Expression of m
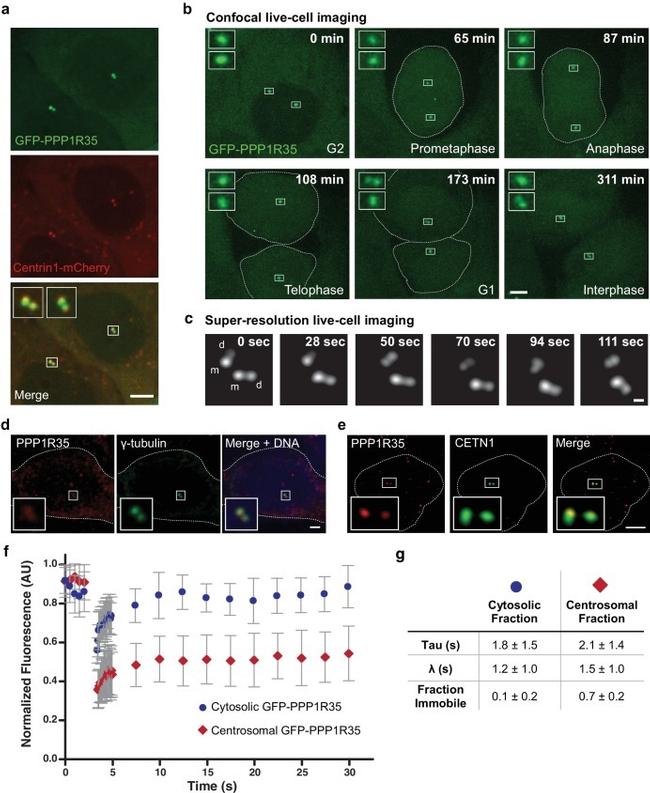
Figure 1. PPP1R35 localizes to the centrosome. ( a ) Confocal microscopy images of live U2OS cells transfected with GFP-PPP1R35 and Centrin1-mCherry. The insets are magnifications of the boxed centrosomes. Scale bar, 5 um. ( b ) Still images from time-lapse live-cell spinning-disc confocal microscopy of U2OS cells expressing GFP-PPP1R35. The time elapsed from the start of movie acquisition is printed in each still image. The insets are 5X magnifications of the boxed centrosomes. For clarity, the outlines of mitotic cells are shown. The extra cytosolic green dots observed in the 65 and 108 min panels are due to camera shot-noise. Scale bar, 5 um. ( c ) Still images from high-speed live-cell imaging of G1/S or early G2 phase centrosome (assignment based on the engaged nature of the centrosomes) on a Leica HyVolution 2 confocal microscope. The time elapsed from the start of the movie is printed in each still image. The mother and daughter centrioles are indicated by m and d, respectively. Scale bar, 250 nm. ( d ) Confocal microscopy images of fixed U2OS cells labeled with an antibody against PPP1R35 and gamma-tubulin. For clarity, the cell outline is shown by a white dotted line. The insets are 4X magnifications of the boxed centrosomes. Scale bar, 2 um. ( e ) 3D Structured Illumination Microscopy images of U2OS cells stained for PPP1R35 and CETN1 (bottom series). For clarity, the cell outline is shown by a white dotted line. The insets are 6X magnifications of the boxed c
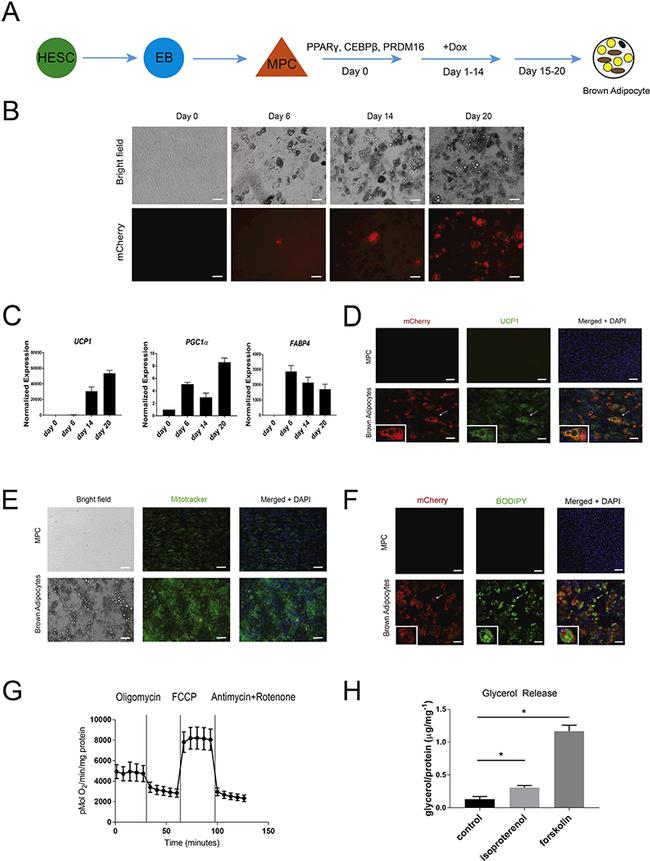
Fig. 2. Differentiation protocol and characterization of mCherry positive cells. (A) Scheme of the stepwise differentiation strategy to differentiate UCP1: mCherry H1 hES cells to brown adipocytes. (B) Fluorescence imaging of the differentiation of UCP1: mCherry H1 hES cells at days 0, 6, 14 and 20 of differentiation. Scale bar = 50 mum. (C) qRT-PCR analysis of differentiating reporter line cultures. Expression was normalized to GAPDH (n = 3 biological replicates, Student's t-test, *p < 0.05, data represented as mean +- S.E.M). (D) Immunostaining of UCP1: mCherry H1 hES cell-derived cells using antibodies against mCherry (red) and UCP1 (green). Differentiated mCherry positive cells show co-expression of UCP1. Arrow refers to cell in inset image. Scale bar = 50 mum. (E) Mitotracker staining (green) of UCP1: mCherry H1 hES cell-derived cells. Scale bar = 50 mum. (F) Immunostaining of UCP1: mCherry H1 hES cell-derived cells using antibody against mCherry (red) and BODIPY against lipid droplets (green). Arrow refers to cell in inset image. Scale bar = 100 mum. (G) Oxygen consumption assay on reporter line derived brown adipocytes. (H) Glycerol release assay of UCP1: mCherry H1 hES cell-derived cells. Cells were incubated with either 20 pm isoproterenol or 10 pm forskolin for 1 h (n = 3 biological replicates, Student's t-test, *p < 0.05, data represented as mean +- S.E.M).
Fig 7 Expression of fluorescently-tagged proteins of multigene families in liver stages of single-gene tagging (SGT) mutants at 48hpi in cultured hepatocytes (Huh7). A . Fluorescence-microscopy analysis of members of the fam-a , fam-b and pir multigene family in live liver-stages. The parasites expressing mCherry-tagged Fam-b2 and PIR1 also express cytoplasmic GFP (cyt GFP; green). B . IFA-analysis of fixed liver-stages using anti-mCherry (red) anti-PbEXP1 (green) antibodies. PbEXP1 is a parasitophorous vacuole membrane resident protein. C Fluorescence-microscopy analysis of expression of SMAC and IBIS, exported proteins encoded by single-copy genes in live liver-stages. Nuclei are stained with Hoechst-33342 (blue); scale bar: 10mum.
Fig 8 Expression of fluorescently-tagged proteins in liver stages of double-gene tagging (DGT) mutants at 48hpi in cultured hepatocytes (Huh7). Fluorescence-microscopy analysis of members of the fam-a ( A ), fam-b ( B ) and pir ( C ) multigene family in live liver-stages of DGT mutants; we were only able to detect both fluorescently-tagged proteins in only one DGT mutant, fam-a1cherry/fam-a2GFP (in 40-45% of the parasites). D . IFA analysis of fixed liver-stages of DGT mutants using anti-GFP (green) and anti-mCherry (red) antibodies. Nuclei are stained with Hoechst-33342 (blue). Scale bar: 10mum.
Published figure using mCherry monoclonal antibody (Product # M11217) in Immunocytochemistry
Figure 3. TEN-domain mutations disrupt telomere localization of telomerase. ( A ) Western blots of lysates of HeLa cells transfected with expression plasmids for various hTERT alleles and hTR, probed with an antibody against hTERT. Actin was used as a loading control. ( B ) Northern blots of RNA isolated from HeLa cells transfected with expression plasmids for various hTERT alleles and hTR, using probes for hTR. In vitro transcribed hTR (500 pg) was used as positive control. Blots were probed for RNase P RNA as loading control. ( C ) Immuno-fluorescence (IF) analysis of HeLa cells transiently transfected with mCherry-hTERT and hTR plasmids. Cells were fixed and probed with antibodies against mCherry, coilin, and TRF2 to visualize telomerase, Cajal bodies and telomeres, respectively. Images were deconvolved. Numbers indicate the fraction of cells analyzed showing the displayed phenotype (scale bar = 5 mum). DOI: http://dx.doi.org/
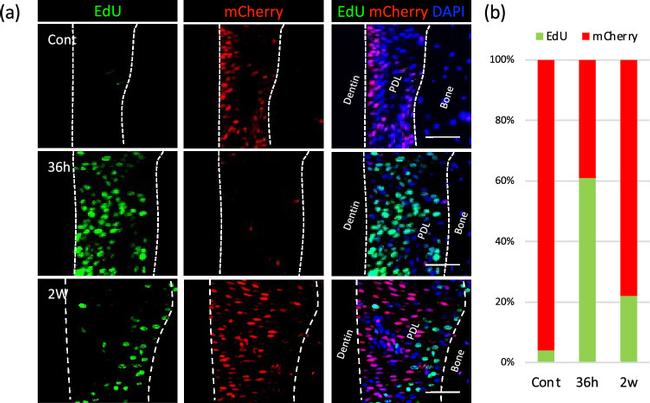
Figure 2 Cell cycle status of PDL cells during OTM. ( a ) Changes in cell cycle status were visualized using Fucci2 mice injected with EdU. The majority of the PDL cells expressed mCherry (red) in control, indicating their status in the quiescent phase. At 36 h, the quiescent cells (red) decreased dramatically, corresponding to increases in proliferating cells (green). At 2 weeks, the majority of the cells returned to the quiescent phase while proliferative activity persisted in some cells. Bar: 50 mum. ( b ) Cell cycle profile showing temporal changes in PDL cell-proliferative activity during OTM.
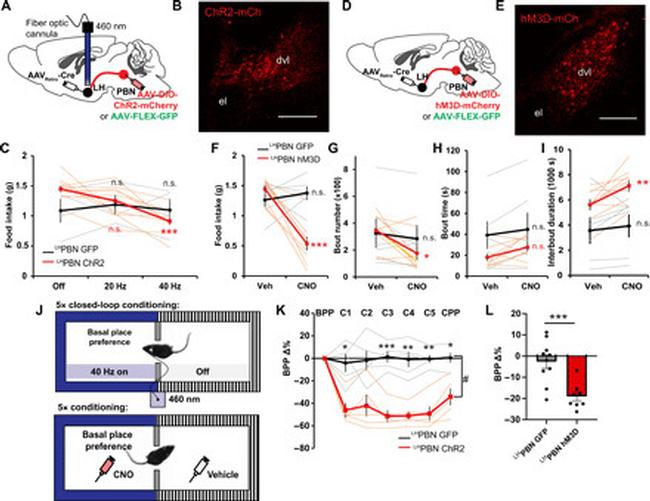
Fig. 2 Optogenetic and chemogenetic activation of LH PBN neurons suppress feeding and transmit negative valence. ( A ) Viral injection strategy enabling GFP or Chr2 expression in LH PBN neurons. An optic fiber was positioned in LH to allow optogenetic stimulation of PBN terminals. ( B ) Representative coronal section showing ChR2-mCherry expressed in LH PBN neurons. ( C ) Amount of food consumed in a 3-hour postfasting refeeding experiment with optogenetic stimulation of PBN terminals in LH at indicated frequencies ( n = 4 and 10 for GFP and ChR2, respectively). ( D ) Viral injection strategy enabling GFP or hM3d-mCherry expression in LH PBN neurons. ( E ) Representative coronal section showing hM3D-mCherry expressed in LH PBN neurons. ( F ) Amount of food consumed in a 3-hour chemogenetic postfasting refeeding experiment with hM3D off (Veh) or on (CNO). GFP served as CNO control [ n = 6 and 9 for GFP and hM3D respectively; also applies to (G) to (I)]. ( G ) Number of feeding bouts in experiment as in (F). ( H ) The averaged duration of feeding bouts in experiment as in (F). ( I ) The averaged interval duration between feeding bouts in experiment as in (F). ( J ) Top: Schematic illustrating the closed-loop optogenetic conditioned place preference test. Blue light was turned on whenever mice entered the paired zone. Bottom: Schematic illustrating chemogenetic conditioned place preference test. Saline was paired with the less preferred zone; CNO was paired with the basal place
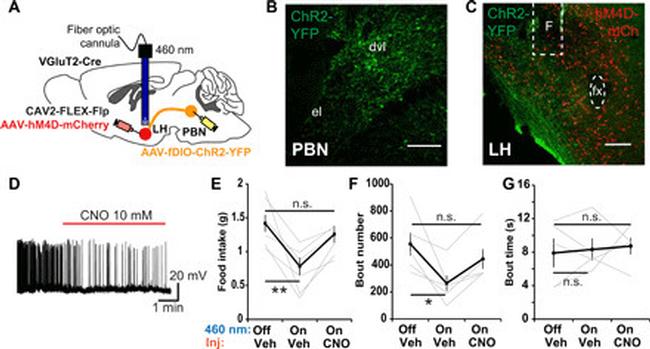
Fig. 6 The effect of LH VGlut2 neurons on feeding depends on downstream LH PBN neurons. ( A ) Schematic illustrating the virus injection strategy to enable ChR2 expression in LH PBN glutamatergic neurons and hM4D in LH glutamatergic neurons. A fiber optic cannula was positioned in LH to allow blue light optogenetic stimulation of PBN terminals. ( B ) Representative coronal section showing the ChR2-YFP expression in LH PBN based on the virus injection strategy in (A). ( C ) Representative coronal section showing the ChR2-YFP-expressing PBN terminals in LH and hM4D-mCh expression in LH VGluT2 neurons based on the virus injection strategy in (A). F denotes fiber optic cannula position. ( D ) Representative trace of a whole cell-patched LH glutamatergic neuron expressing hM4D-mCherry with CNO application (red line) into bath of recording chamber. ( E ) Amount of food consumed in 3-hour feeding experiment postovernight fasting. Each mouse was subjected with three consecutive experiment trials on different days: (i) 460 nm-off hM4D-off (Veh), (ii) 460 nm-on hM4D-off (Veh), (iii) 460 nm-on hM4D-on (CNO) ( n = 6). ( F ) Number of feeding bouts in experiment as in (E) ( n = 5). ( G ) The mean time duration of all feeding bouts in experiment as in (E) ( n = 5). Thick lines represent means +- SEM, and thin lines represent individual mouse. n.s., P >= 0.05; * P < 0.05; ** P < 0.01. Scale bars, 200 mum. See also table S1 for statistical details.
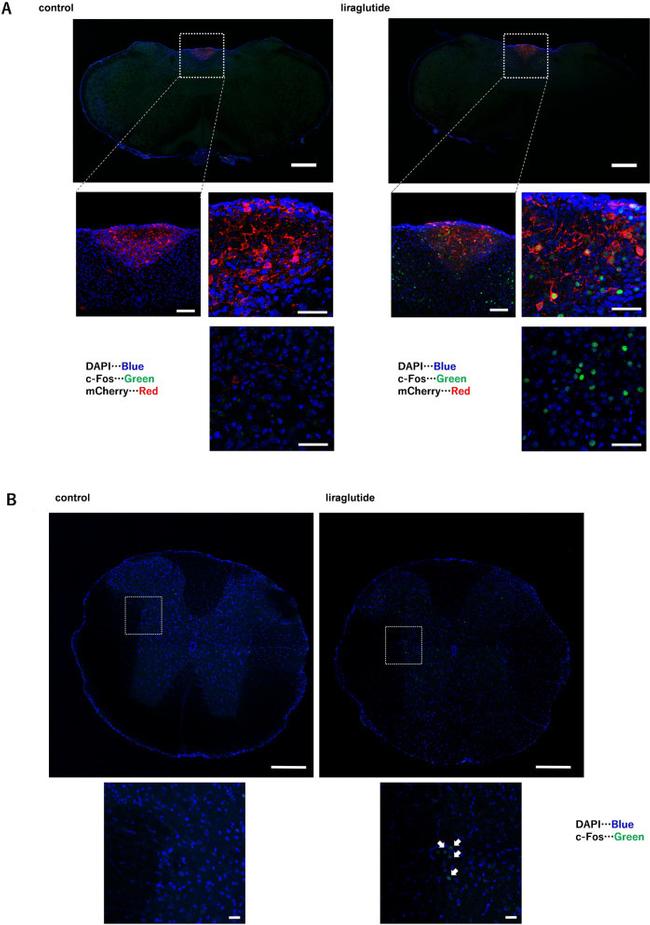
Figure 4 Liraglutide enhances c-Fos staining, not only in the AP/NTS, but also in the IML. Representative image of immunohistochemistry for c-Fos in ( A ) the AP and NTS and ( B ) the IML with or without acute liraglutide administration. In ( A ), the top and middle left images are the original magnification, whereas the middle right and lower images are the original magnification x 40. Scale bars: 500 um in the top image, 100 um in the middle left image, and 50 um in the middle right and lower images in ( A ). All images are the original magnification in ( B ). Scale bars: 200 um in the top image, 20 um in the lower image in ( B ). Arrows indicate c-Fos staining in ( B ).
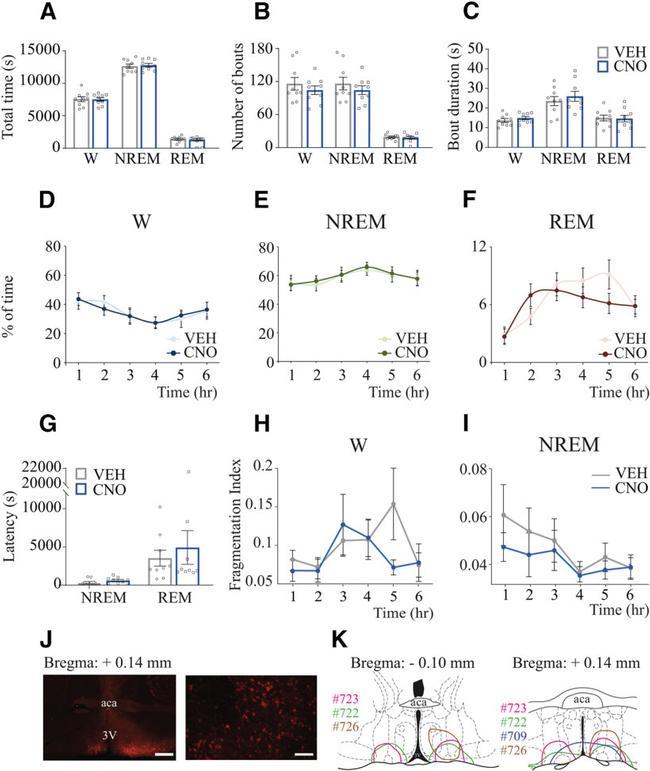
Figure 7. CNO administration to Vglut2-Cre mice that did not express designer receptors did not alter sleep-wake states. Sleep data from Vglut2-Cre mice injected with (1) AAV-hSyn-DIO-hM3D(Gq)-mCherry into the preoptic area but did not express designer receptors ( n = 5) and (2) the control vector AAV-hSyn-DIO-mCherry ( n = 4) were pooled together and used as negative controls. A , Group data summarizing total time in wakefulness, NREM sleep, and REM sleep after VEH or CNO (1.0 mg/kg) injection. B , Number of bouts of wakefulness, NREM sleep, and REM sleep. C , Comparison of mean episode duration per state. A one-tailed paired t test with Bonferroni correction was used for statistical comparisons between treatment conditions. D-F . Graphs plot the mean time (expressed as percent of total recording time) in wakefulness, NREM sleep, and REM sleep, respectively, for each 1 h block after VEH and CNO administration. Two-way repeated-measures ANOVA followed by a Bonferroni test was used for statistical comparisons. G , Latency to NREM and REM sleep. A one-tailed paired t test was used for statistical comparisons between treatment conditions. H , I , FI calculated for NREM and REM sleep, respectively, plotted for each 1 h block after VEH and CNO injection. Wilcoxon matched-pairs rank tests were used for statistical comparisons between treatment conditions. Data are mean +- SEM. J , Left, Right, Low- and high-magnification photographs, respectively, of mCherry immunohistochemical sta
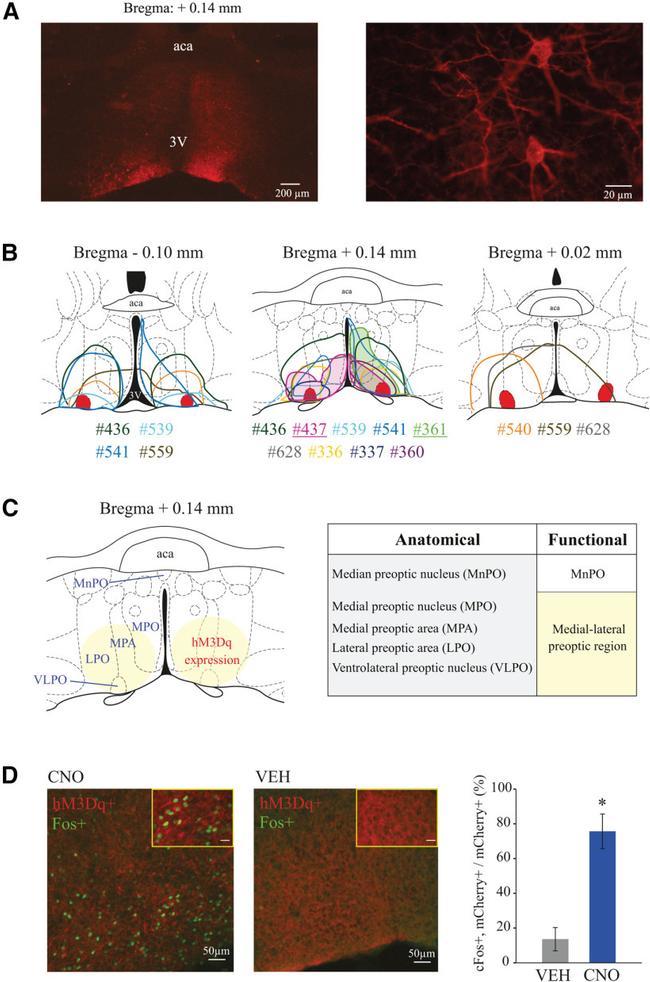
Figure 1. Histologic confirmation of hM3Dq receptor expression in the preoptic area of Vglut2-Cre mice used in sleep studies, and confirmation of neuronal activation caused by CNO administration. A , Left, Right, Examples of low- and high-magnification photographs, respectively, of mCherry immunohistochemical staining (red), indicating the expression of the excitatory designer receptor hM3Dq within the VLPO of a Vglut2-Cre mouse. B , Color-coded depiction of the area of hM3Dq receptor expression is represented on coronal schematics of the preoptic area modified from a mouse brain atlas (). Middle, Filled areas of hM3Dq expression highlight mice #437 and #361 (also indicated by underlined numbers below the brain schematic), which had the largest increase in sleep and wakefulness, respectively. For anatomic reference, solid red represents the bilateral sites corresponding to the VLPO. Color-matched identification numbers for each mouse used in the sleep studies ( n = 11) are listed below each panel. C , Schematic of the preoptic area illustrating relevant anatomic subdivisions and main area of designer receptor expression (yellow circles). Right, Chart compares the anatomic subdivisions and functional nomenclature used in this study. Based on the uniform response to chemogenetic stimulation, different from that observed in MnPO studies (), the area of hM3Dq receptor expression in the current study is referred to as the medial-lateral preoptic region. D , cFos expression (green
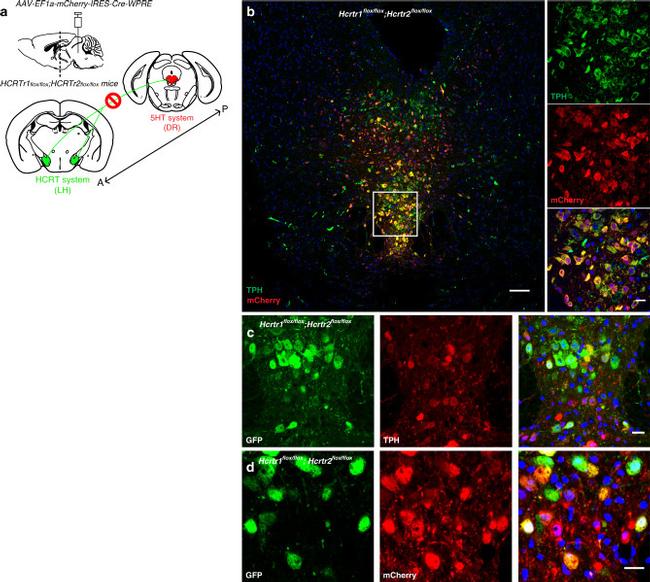
Fig. 4 Inactivation of Hcrtr1 & 2 in the DR. a Schematic figure depicting the experiment where the HCRT input (from posterior "P" to anterior "A) to the dorsal raphe (DR) is disrupted. b Representative confocal image of the DR of Hcrtr1&2 double-floxed homozygous mice injected with AAV-EF1a-mCherry-IRES-Cre-WPRE and stained with mCHERRY (red) and TPH (green) antibodies. mCHERRY-positive cells (red) are highly co-localized with TPH-positive cells (green). Higher magnification (x40, right). c , d GFP is expressed after Cre recombination. TPH-positive cells ( c middle red) transduced with Cre virus ( d middle red) are positive for GFP ( c and d , left green). Scale bars: b 100 mum, rest 20 mum.
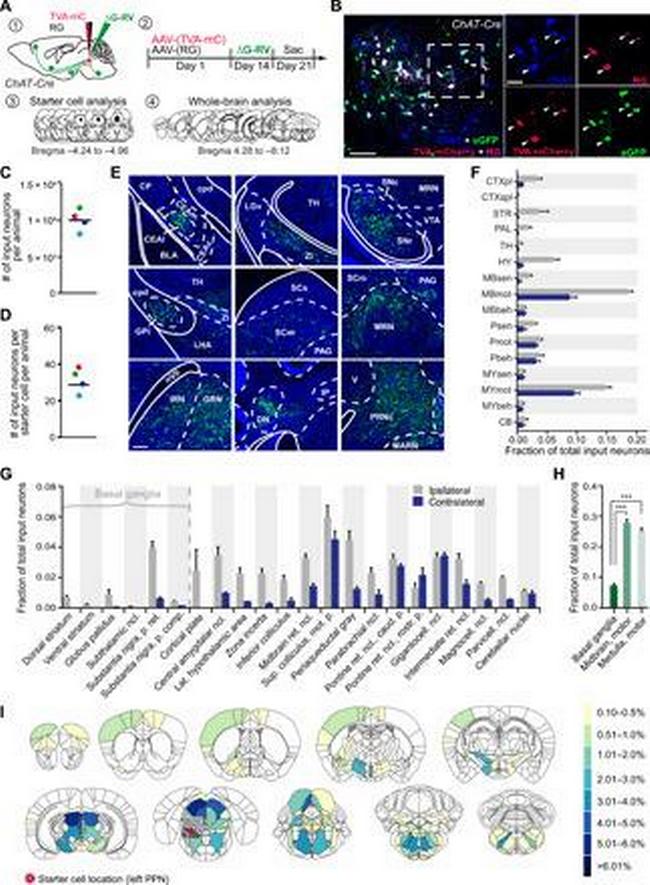
Presynaptic inputs to PPN CNs revealed by rabies-mediated retrograde tracing. ( A ) Schematic showing strategy of trans-synaptic tracing. ( B ) Injected PPN region stained for ChAT, RG, and mCherry. Starter cells (arrowheads) costain for RG, mCherry (indicator for TVA expression), and eGFP (indicator for rabies). ( C ) Number of traced eGFP-positive input neurons per animal. ( D ) Calculation of the convergence index revealed 32 presynaptic input neurons per starter cell. ( E ) Monosynaptic input neurons in selected brain areas. ( F ) Quantification of presynaptic neurons in gross anatomical regions normalized against the total number of input neurons throughout the respective brain. ( G ) Fraction of total input neurons for basal ganglia structures and other brain regions accounting for at least 1% of total input. ( H ) PPN CNs receive significantly more synaptic input from midbrain and motor-related medullar brain regions than from basal ganglia structures (one-way ANOVA followed by Tukey's multiple comparisons test). ( I ) Heatmaps of inputs to cholinergic PPN neurons accounting for more than 0.1% of all inputs. Color scale represents the percentage of total inputs. Red circle indicates the location of starter cells. Quantification includes n = 4. Scale bars, 100 mum (B; overview), 50 mum (B; high magnification), and 250 mum (E). *** P < 0.001. All abbreviations used can be found in table S2 in the Supplementary Materials.
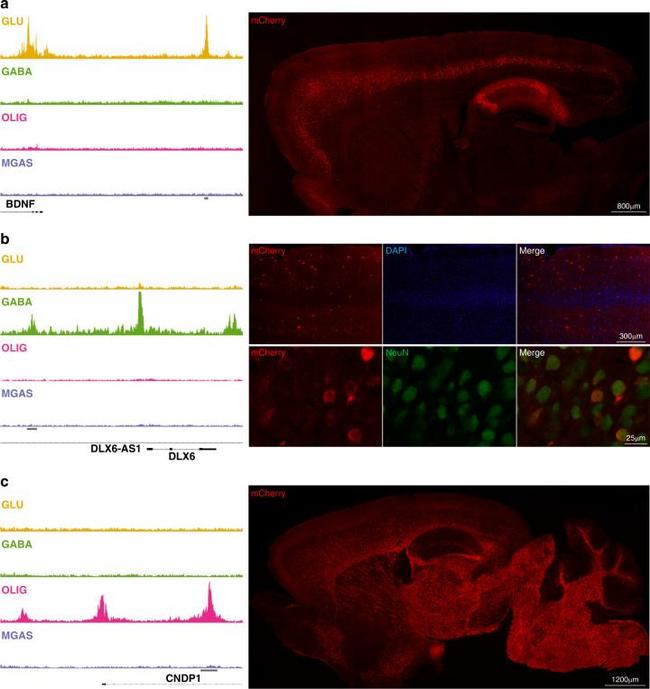
Transgenic evaluation of putative cell-type-specific enhancers. Left column: Cell-type-specific OCRs identified by ATAC-seq and nearby genes: ( a ) glutamatergic ( BDNF ), ( b ) GABAergic ( DLX6 ), and ( c ) oligodendrocytes ( CNDP1 ). The horizontal gray bars denote OCR assayed in directed transcription via transgenesis. Right: Representative immunofluorescent images showing mCherry (red) expression in 30 um thick sagittal sections from ( a ) BDNF and ( c ) CNPD1 transgenic mice. In ( a ), specific mCherry expression is identified in Layer V of the cortex and in hippocampus. In ( b ) representative images of mCherry (red) staining in the cortex of DLX6 transgenic mice (top panel) and double labeling with NeuN (green; bottom panel), showing expression restricted to neurons and scattered in the cortex, similar to the distribution of GABAergic interneurons. In ( c ) mCherry expression is shown to be restricted to white matter. Four image frames of three independent brain slices per each mouse were analyzed (BDNF enhancer n = 5; DLX6 enhancer n = 6; CNDP1 enhancer n = 4).
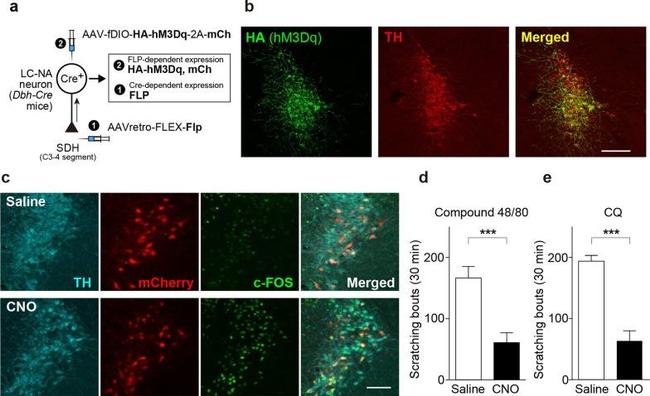
Chemogenetic activation of descending LC-NAergic neurons inhibits acute itch. a. A schematic illustration of the retrograde transduction strategy for hM3Dq expression in descending LC-NAergic neurons. b Representative images of hM3Dq (detected by HA immunostaining, green) and TH (red) expression in LC-NAergic neurons (visualized by TH immunostaining) in mice injected with the two AAV vectors. Scale bar, 200 mum. c Expression of c-FOS (green) in hM3Dq-expressing descending LC-NAergic neurons (visualized by mCherry and TH immunostaining) 2 h after administration of saline or CNO (10 mg/kg, i.p.) to AAV-injected mice. Scale bar, 100 mum. Scratching events induced by intradermal injection of compound 48/80 (50 mug/50 mul, d ) or CQ (200 mug/50 mul, e ) 20 min after CNO (10 mg/kg) or saline administration to AAV-injected mice ( d : saline, n = 7; CNO, n = 8, e : saline, n = 5; CNO, n = 7, *** P < 0.001). Data show the mean +- SEM
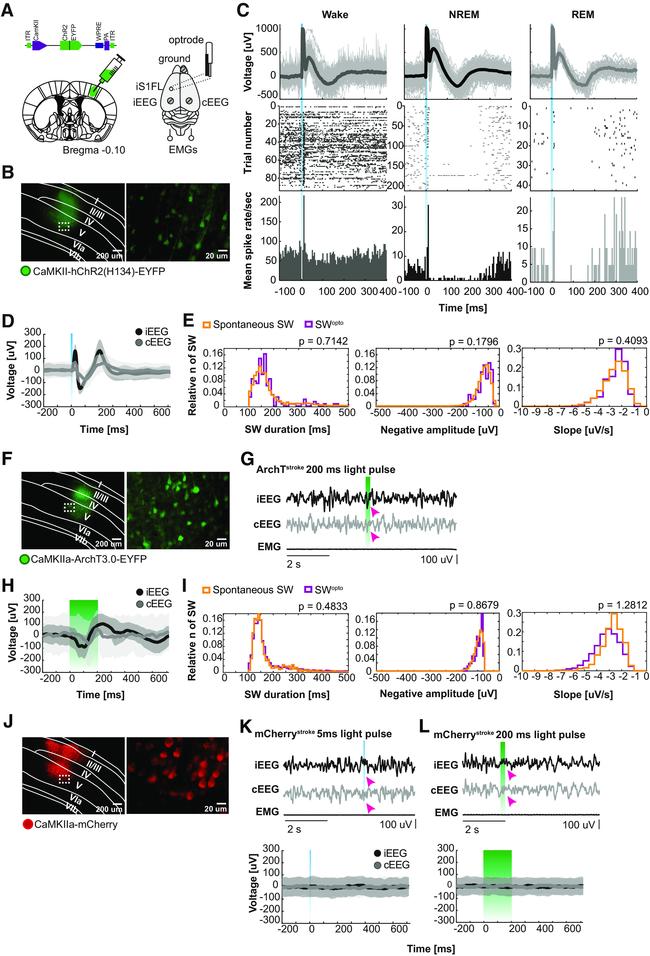
Figure 3. Optogenetic induction of SW-like bistable oscillations. A , Scheme of a coronal brain section with AAV injection site (left), AAV structure (top), and optrode/EEG/EMG implantation representation (right). B , Opsin distribution within the peri-infarct iS1FL following AAV injection of CaMKII-ChR2-EYFP. C , LFP traces, single-unit activity, and correspondent raster plot and mean spike rate on optogenetic stimulation during wakefulness (left), NREM sleep (middle), and REM sleep (right) from one representative stimulation session. D , Average ipsilateral (iEEG) and contralateral EEG (cEEG) traces response to activation (ChR2) of pyramidal neurons with 5 ms of single laser light pulses (473 nm). E , Comparison between spontaneous and optogenetically evoked SW (SW opto ) duration (left), negative amplitude (middle), and slope (right) during NREM sleep for ChR2-stimulated animals. Wilcoxon rank sum test, statistically significant if p < 0.05. F , ArchT distribution within iS1FL. G , Representative EEG/EMG traces on silencing of pyramidal neurons with 200 ms of single laser light pulses (532 nm) during NREM sleep. H , Average iEEG and cEEG responses to ArchT stimulation. I , Comparison between SW opto duration (left), negative amplitude (middle), and slope (right) during NREM sleep for ArchT-stimulated animals. Wilcoxon rank sum test, statistically significant if p < 0.05. J , mCherry (control) expression in iS1FL. K , representative EEG/EMG responses during 5 ms light pulse
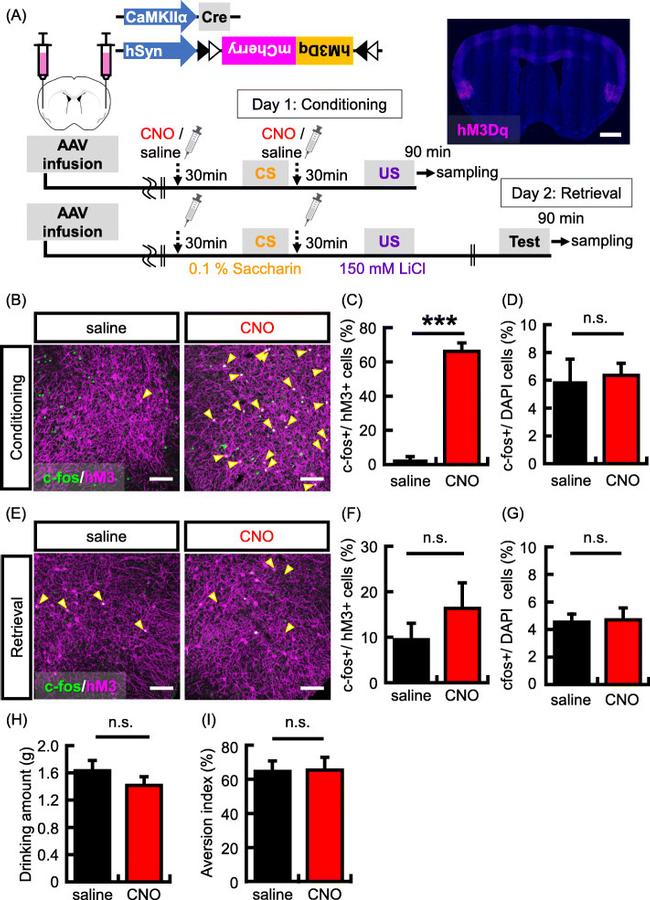
Fig. 1 Increasing neuronal activity in a subset of IC neurons during CTA conditioning. a The top panel shows the map of the AAV constructs. Bottom panel shows experimental schema. Representative picture showing localized hM3Dq (magenta) expression in the IC by hM3Dq-mCherry virus infection. Scale bar = 1000 um. b Representative images showing expression of c-fos (green) following conditioning and hM3Dq (magenta). Yellow arrows indicate double-labeled neurons (c-fos + and hM3Dq+). Scale bar = 100 um. (C-D) Probability of expression of c-fos (c-fos+) in cells transduced with the hM3Dq viruses (hM3Dq + neurons) ( c ) and stained with DAPI (DAPI+ cells) ( d ) in the IC ( N = 3 in each group). e Representative images showing expression of c-fos (green) following memory retrieval test and hM3Dq (magenta). Scale bar = 100 um. f - g Probability of occurrence of c-fos + neurons in the hM3Dq + neurons ( f ) and DAPI+ cells ( g ) in the IC ( N = 7 in each group). h Data show the mean quantity of saccharine solution consumed during the conditioning. i Data showing the aversion index in the memory retrieval test ( N = 13 in each group). Data are presented as mean +- SEM; *** p < 0.001 (saline-injected mice, black columns; CNO-injected mice, red columns)
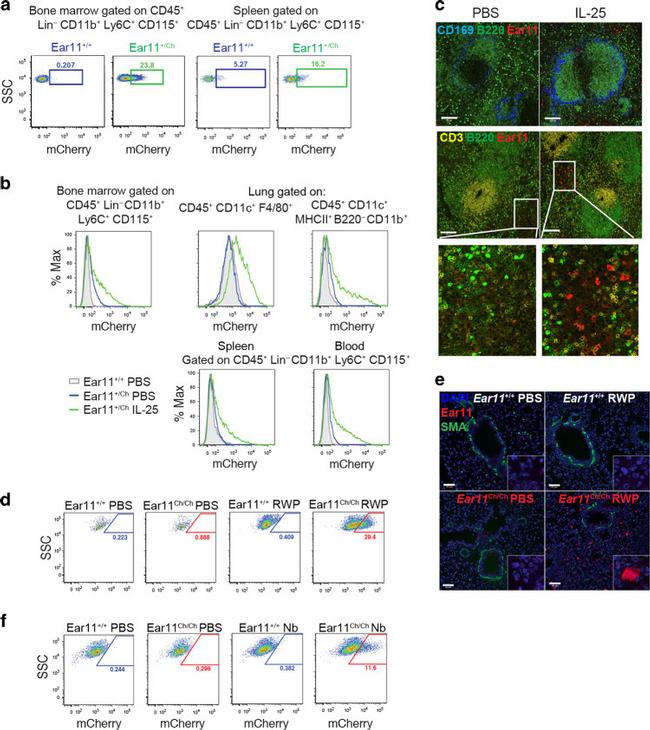
Fig. 3 Ear11 mCherry is expressed in monocytes, macrophages, and DCs during a type-2 response. a Flow cytometric analysis of Ear11 mCherry expression in naive Ear11 +/+ and Ear11 +/Ch and b mice treated intraperitoneally (bone marrow, spleen, and blood) or intranasally (lung) as indicated (see Supplementary Fig. 5a-d for gating). Representative of 2-3 independent experiments (with 3-4 mice per experiment). c Confocal microscopy of spleen sections from Ear11 +/Ch mice treated intraperitoneally as shown (2 independent experiments, n = 4). Top row shows the marginal (blue) and B cell zones (green). Middle row depicts T cell (yellow) and B cell (green) zones labelling the white pulp of the spleen (bottom row shows enlargement of Ear11 mCherry expression in PBS and cytokine-stimulated spleen). x20 magnification, 100 mum scale bar. d Flow cytometric analysis of CD45 + CD11c + F4/80 + alveolar macrophages and e confocal microscopy of lung taken from Ear11 +/+ and Ear11 Ch/Ch mice treated intranasally with PBS or RWP. e Airways and blood vessels stained with smooth muscle actin (SMA, green); all nuclei were counterstained with DAPI (blue). Two independent experiments, n = 5-8; x20 magnification with x63 inset, 50 mum scale bar. f Ear11 mCherry expression in CD45 + CD11c + F4/80 + alveolar macrophages on day 32 post infection with N. brasiliensis by flow cytometry (data representative of two independent experiments, n = 4-7).
Published figure using mCherry monoclonal antibody (Product # M11217) in Immunohistochemistry
Figure 3--figure supplement 1. Bilateral delivery of AAV- lacZ , and AAV- Esr1 (g1 and g2) to AVPV of adult female mice. Immunofluorescence was used to detect GFP (green), mCherry (red) and immunohistochemistry to detect ERalpha (black).
Figure 7. c-FOS activity in the SuM does not increase after CNO treatment. A , c-FOS expression in the mammillary region after treatment with SAL followed by 90 min of SD. B , c-FOS expression in the SuM after CNO treatment showing similar c-FOS expression than SAL treatment. C , mCherry immunohistochemistry for the region depicted in B showing hM3Dq expression only in the lateral regions and almost no labeling in the medial aspect of SuM. Black dotted lines indicate the approximate region used for counting c-FOS in the SuM. LM, lateral mammillary nucleus; MM, medial mammillary nucleus. Scale bar = 250 mum.
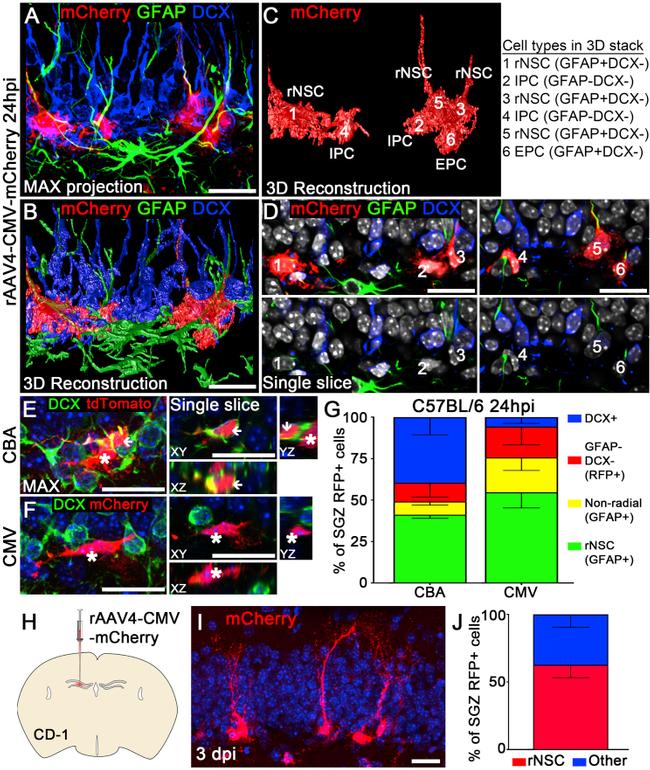
Figure 2 rAAV4 Vectors with Distinct Promoters Reveal Differential Selectivity for rNSCs (A) Confocal imaging of AAV4-CMV-mCherry-transduced cells stained for RFP, GFAP, and DCX. z-Stack confocal data were maximum-intensity projected in ImageJ. (B) 3D reconstruction of a deconvoluted confocal image in (A) using Huygens Professional software. (C) Six cells were classified for cell identity based on morphology and cell stage markers. (D) Confocal images showing marker expression of cells (from A) at a single focal plane. Three RFP + cells (cells 1, 3, 5) with radial processes expressed GFAP but not DCX. These cells were classified as rNSCs. One non-radial precursor cell (cell 6) expressed GFAP but not DCX. Cells of this stage were classified as early progenitor cells (EPCs). Two RFP + cells (cells 2 and 4) did not express GFAP and DCX. These cells were classified as intermediate progenitor cells (IPCs). (E and F) Confocal images showing the DCX expression in RFP + cells transduced by rAAV4-CBA-tdTomato (E) and rAAV4-CMV-mCherry (F). Note some rAAV4-CBA-tdTomato-transduced RFP + cells were DCX + (arrowhead), and some were DCX - (asterisks); in contrast, most rAAV4-CMV-mCherry-transduced RFP + cells were DCX - . (G) Quantification of the cell types found in CBA-injected and CMV-injected mice at 24 hpi (n = 3 mice). (H-J) rAAV4-CMV-mCherry displayed similar tropism for rNSCs in CD-1 mice compared with C57BL/6 mice at 3 days post injection (dpi) (n = 3 mice). Scale bars, 20 mum. Va
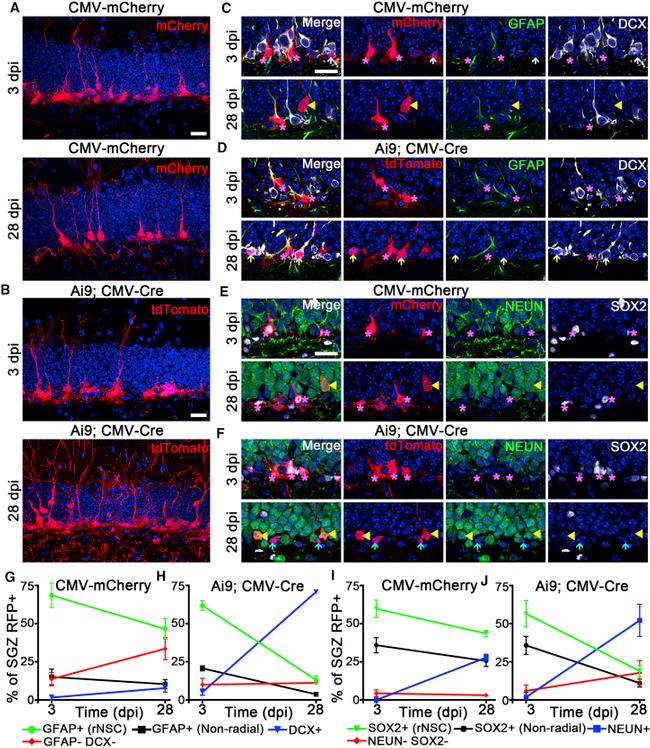
Figure 4 rAAV4 Allows for Lineage Tracing of Quiescent NSCs in the Adult Hippocampus (A) Maximum projection of rAAV4-CMV-mCherry-injected mice stained for mCherry using RFP antibody at 3 and 28 dpi. RFP + rNSCs were found at 3 and 28 dpi, and RFP + mature neurons were found at 28 dpi. (B) Maximum projection of Ai9; rAAV4-CMV-Cre/GFP-injected mice stained for tdTomato using RFP antibody at 3 and 28 dpi. RFP + rNSCs were found at 3 and 28 dpi, and RFP + mature neurons were observed at 28 dpi. (C-F) Lineage tracing was performed using two sets of cell stage markers, including GFAP/DCX and SOX2/NeuN, and representative confocal images shown at 3 and 28 dpi from the two viral strategies. In (C), at 3 dpi RFP + cells were GFAP + rNSCs (purple asterisks) and GFAP - and DCX - IPCs (light-blue arrow); at 28 dpi RFP + cells were GFAP + rNSCs (purple asterisks) and GFAP - , DCX - mature neurons (yellow arrowheads). In (D), at 3 dpi RFP + cells in Ai9 mice were GFAP + rNSCs (purple asterisks); at 28 dpi RFP + cells were GFAP + rNSCs (purple asterisks) and DCX + , GFAP - neuroblasts (light-yellow arrows). In (E), at 3 dpi RFP + cells were SOX2 + , NeuN - rNSCs (purple asterisks); at 28 dpi RFP + cells were SOX2 + , NeuN - rNSCs (purple asterisks) and NeuN + , SOX2 - neurons (yellow arrowheads). In (F), at 3 dpi RFP + cells in Ai9 mice were SOX2 + , NeuN - rNSCs (purple asterisks); at 28 dpi RFP + cells were NeuN + , SOX2 - neurons (yellow arrowheads) and NeuN - , SOX2 - neuroblast-like ce
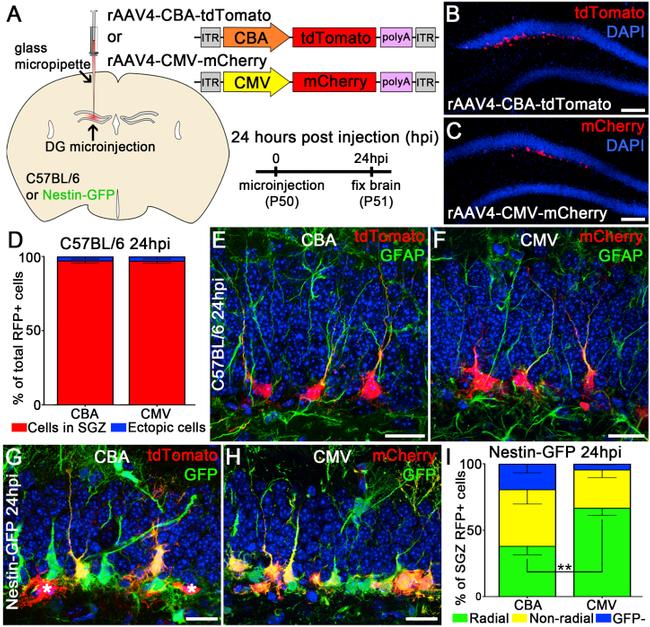
Figure 1 rAAV4 Preferentially Transduces Quiescent NSCs in the Adult DG (A) Schematic of viral microinjection and viral constructs. (B) Low-magnification confocal image of the DG injected with AAV4-CBA-tdTomato (CBA) at 24 hr post injection (hpi). (C) Low-magnification confocal image of the DG injected with AAV4-CMV-mCherry (CMV) at 24 hpi. (D) Quantification of the distribution of RFP + cells in the SGZ versus elsewhere in the DG (n = 3 mice). (E and F) Representative confocal image of RFP + cells transduced with rAAV4-CBA-tdTomato (E) or rAAV4-CMV-mCherry (F) at 24 hpi in C57BL/6 mice. Note the RFP + cells expressing GFAP marker and showing radial morphology. (G and H) Representative confocal image of RFP + cells transduced with rAAV4-CBA-tdTomato (G) or rAAV4-CMV-mCherry (H) at 24 hpi in Nestin-GFP mice. RFP + cells were either co-labeled with tdTomato and GFP (yellow color) or RFP only (indicated by asterisk). (I) Quantification of co-localized RFP + GFP + rNSCs in the SGZ of Nestin-GFP mice injected with rAAV4-CBA or rAAV4-CMV. RFP + cells were classified as (1) radial: rNSCs with a radial process and GFP + (green); (2) non-radial: neural precursors without radial processes and GFP + (yellow); and (3) GFP - cells (blue). The percentage of rAAV4-CMV-labeled rNSCs was significantly higher ( ** p < 0.005, n = 3 mice) than that of rAAV4-CBA-labeled rNSCs. Scale bars, 100 mum (B and C) and 20 mum (E-H). Values represent mean +- SD. See also Figure S1 .
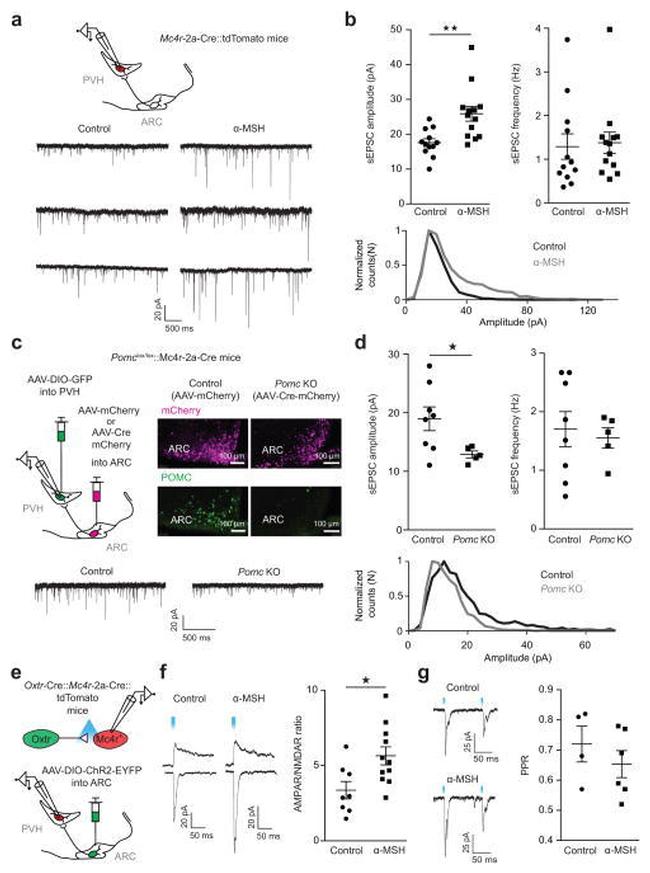
Figure 7 alpha-MSH post-synaptically increases excitatory input onto PVH MC4R neurons a , Top, experimental schematic. a , b , Representative traces ( a, bottom) and summary ( b ) of alpha-MSH effects on sEPSCs. 8 slices from 4 mice; mice from multiple litters; sample size (cells): control/alpha-MSH, n = 12/13. sEPSC amplitude: Control (M = 17.6, s.d. = 3.923) versus alpha-MSH (M = 25.88, s.d. = 7.668): Unpaired two-tailed t-test, t(23) = 3.353, ** P = 0.0028. sEPSC frequency: Control (M = 1.29, s.d. = 1.011) versus alpha-MSH (M = 1.379, s.d. = 0.8736): Two-tailed Mann-Whitney test: U = 65, P = 0.4951 b , Bottom, sEPSC amplitude distribution showing that alpha-MSH significantly increased the frequency of large-amplitude sEPSCs (Kolmogorov-Smirnov test, P < 0.0001). c , Left, experimental schematic. Right, POMC and mCherry immunolabeling in control and Pomc knockout ( Pomc KO) mice. c , d , Representative traces ( c , Bottom) and summary ( d ) of Pomc KO effects on sEPSCs. Number of slices: Control/Pomc KO, N = 4/4. Number of animals: Control/Pomc KO, N = 2/2. Sample size (cells): Control/Pomc KO, n = 8/5; sEPSC amplitude: Control (M = 18.96, s.d. = 5.721) versus Pomc KO (M = 12.88, s.d. = 1.293): Unpaired two-tailed t-test, t(11)= 2.304, * P = 0.0417. sEPSC frequency: Control (M = 1.703, s.d. = 0.853) versus Pomc KO (M = 1.553, s.d. 0.3897): Unpaired two-tailed t-test: t(11) = 0.3653, P = 0.7218. Bottom, sEPSC distribution showing decreased fr
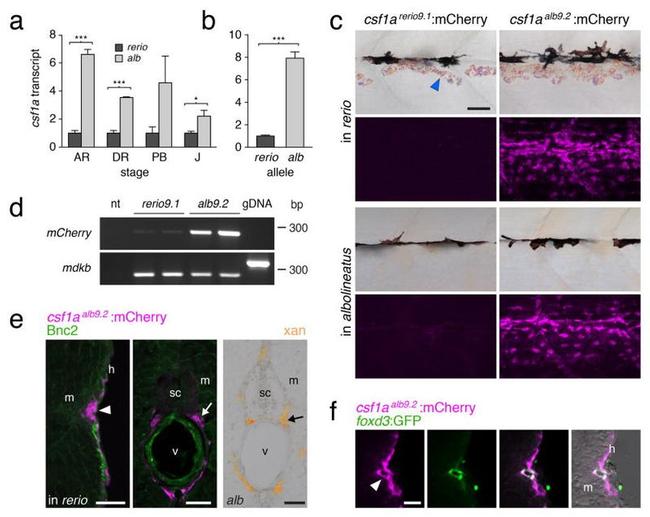
Figure 2 Enhanced Csf1 expression in D. albolineatus through cis regulatory evolution ( a ) csf1a transcript abundance during adult pigment pattern development in D. albolineatus relative to D. rerio for internal trunk tissue (mean+-s.e.m.; n =3 biological replicates for all sample). *** P <0.0001; * P <0.05. (Stages: AR, anal fin ray appearance; DR, dorsal fin ray appearance; PB, pelvic bud appearance; J, juvenile.) ( b ) Increased expression of D. albolineatus csf1a allele in D. rerio x D. albolineatus hybrids (mean+-s.e.m.; paired t =12.8, d.f.=4, P <0.0005; n =5 biological replicates) ( c ) mCherry in AR+ stage Tg(csf1a rerio9.1 :mCherry) (left) and Tg(csf1a alb9.2 :mCherry) (right), in D. rerio (top) and D. albolineatus (bottom). Images for csf1a rerio9.1 :mCherry were exposed twice as long yet show only background fluorescence. ( d ) csf1a rerio9.1 :mCherry was detectable at low levels. midkine b ( mdkb ), control target amplifying 259 bp from cDNA or 334 bp with intron from genomic DNA (gDNA); nt, no template. ( e ) csf1a alb9.2 :mCherry in D. rerio (magenta, arrowhead) in hypodermis (h), adjacent to the myo-tome (m) and also medially (arrow) in the vicinity of the spinal cord (sc) and vertebral column (v), corresponding to ventral motor nerves. Basonuclin-2 (Bnc2; green) promotes Csf1 expression in D. rerio 22 , but Bnc2 + cells did not co-express mCherry. Right, extra-hypodermal xantho-phores (arrow) in D. albolineatus . ( f ) At the hypodermis, csf1a alb9.2 :mCherry
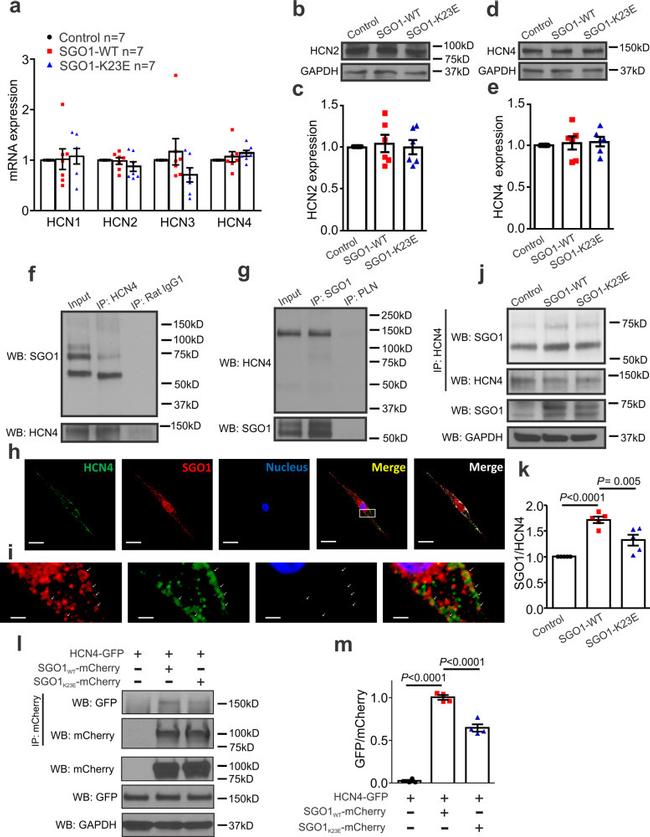
Fig. 4 SGO1 interaction with HCN4. a SGO1-WT and SGO1-K23E transduction did not change HCN1, HCN2, HCN3, or HCN4 mRNA expression in NRVMs. n = 7 biologically independent preparations, each exposed in parallel to each condition. Data are expressed as mean +- SEM, normalized to respective control sample result for each preparation. b, c Transduction of SGO1-WT or SGO1-K23E did not affect HCN2 protein expression. n = 5 biologically independent preparations, each exposed in parallel to each condition. Data are expressed as mean +- SEM, normalized to respective control sample result for each preparation. d, e Transduction of SGO1-WT or SGO1-K23E did not change HCN4 protein expression. n = 5 biologically independent preparations, each exposed in parallel to each condition. Data are expressed as mean +- SEM, normalized to respective control sample result for each preparation. f Co-IP of native SGO1 with HCN4 in non-transduced NRVMs. NRVM lysates were incubated with HCN4 antibody or rabbit IgG (isotype antibody control); SGO1 antibody was used to detect SGO1 bands. Similar results were obtained in n = 5 biologically independent experiments. g A reverse co-IP with phospholamban (PLN) antibody as the isotypic antibody control. NRVM lysates were loaded as the input control in f and g . IP: immunoprecipitation. WB: Western blot. Similar results were obtained in n = 5 biologically independent experiments. h Confocal images from NRVM slides showing colocalization between native HCN4 and SG
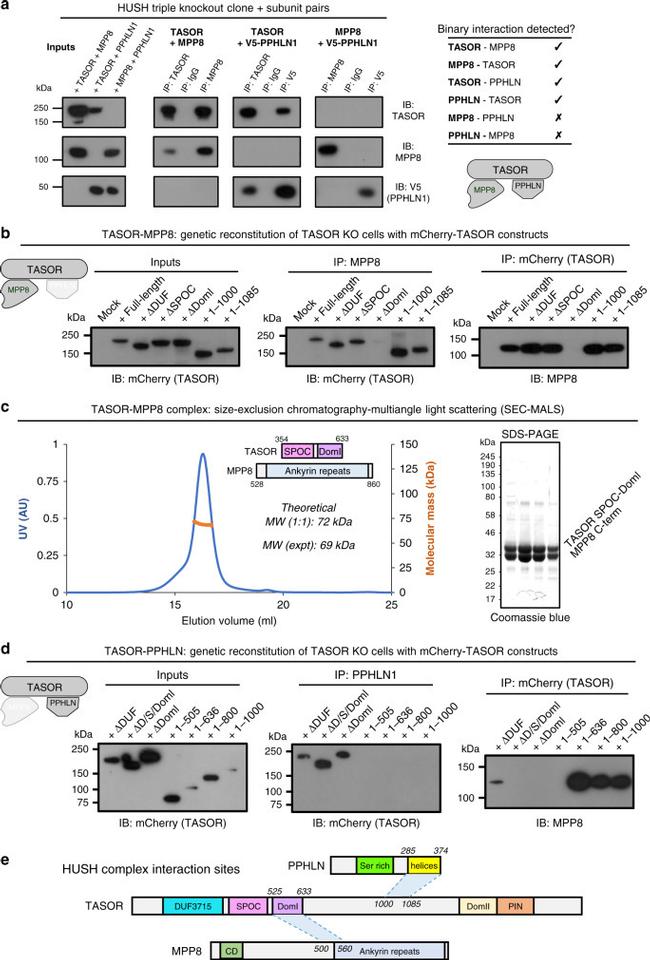
Fig. 3 TASOR lies at the heart of the HUSH complex. a TASOR interacts separately with MPP8 and Periphilin to mediate assembly of the HUSH complex. Pairwise combinations of HUSH subunits were exogenously expressed in HUSH triple KO cells, and interactions detected by co-immunoprecipitation (co-IP) followed by immunoblot. b TASOR DomI mediates the interaction with MPP8. The indicated TASOR truncation mutants were exogenously expressed in TASOR KO cells and their association with endogenous MPP8 assessed by co-IP. c SEC-MALS of recombinant TASOR(354-633)-MPP8(528-860) complex (theoretical MW, 72 kDa for a 1:1 complex) with representative SDS-PAGE gel of SEC peak fractions (inset). d The central linker of TASOR mediates the interaction with Periphilin. e Summary of core HUSH interaction sites.
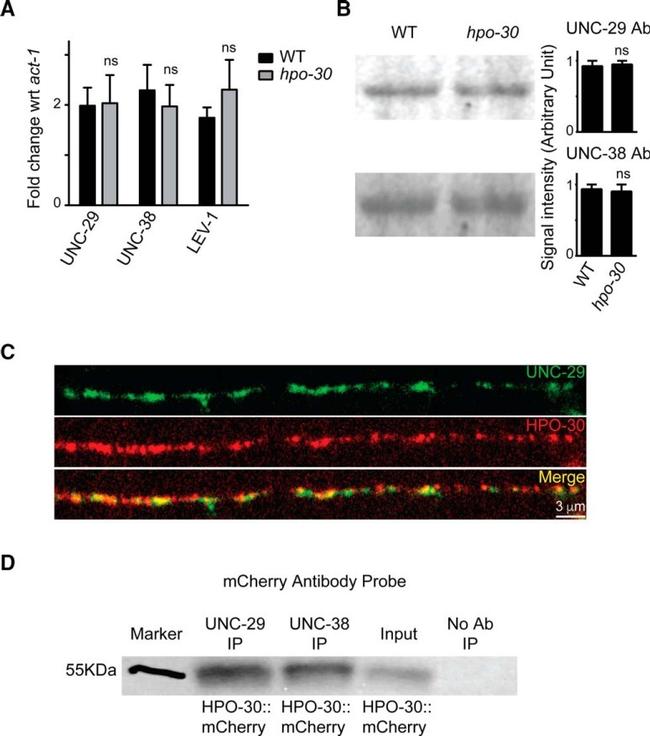
Figure 6. The expression level of LAChRs is unaffected in hpo-30 mutants. A , qPCR experiments comparing the levels of unc-29 , unc-38 , and unc-63 in WT and hpo-30 mutant animals. B , Images and graphs of Western blots indicating the protein levels of UNC-29 and UNC-38 in WT and hpo-30 C. elegans . Data are mean +- SEM. C , Distribution of HPO-30::mCherry and UNC-29::GFP in muscles. D , Coimmunoprecipitation of HPO-30::mCherry using anti-UNC-29 and anti-UNC-38 antibodies. As a control, the protein extracts are allowed to incubate with beads only without the antibody. The coimmunoprecipitated complex was then probed with an anti-mCherry antibody.
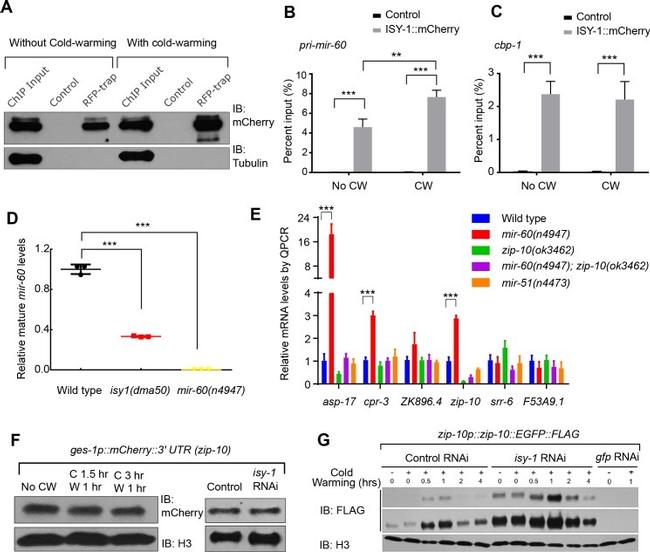
Figure 4. ISY-1 regulates zip-10 via mir-60 . ( A ) Western blot of mCherry/RFP-trapped RNA immunoprecipitates in animals treated with or without cold-warming. ( B ) QPCR measurements of the percent input for primary mir-60 transcripts from mCherry/RFP-trapped RNA immunoprecipitates in animals treated with or without cold-warming. ( C ) QPCR measurements of the percent input for cbp-1 transcripts from mCherry/RFP-trapped RNA immunoprecipitates in animals treated with or without cold-warming. ( D ) QPCR measurements of the mature mir-60 transcript levels from wild type, isy-1(dma50) and mir-60(n4947) deletion mutants. ( E ) QPCR measurements of the levels of CW-inducible gene transcripts in animals with indicated genotypes and conditions. ( F ) Western blot of lysates from animals carrying the array ges-1p::mCherry::3'utr(zip-10) reporters with CW or isy-1 RNAi. No change of reporter activity was observed. ( G ) Western blot of lysates from animals carrying zip-10p::zip-10::EGFP::FLAG reporters with various indicated CW and RNAi conditions. n >= 20 total animals for each group with N >= 3 independent biological replicates; *** indicates p<0.001; ** indicates p<0.01.
Published figure using mCherry monoclonal antibody (Product # M11217) in Western Blot
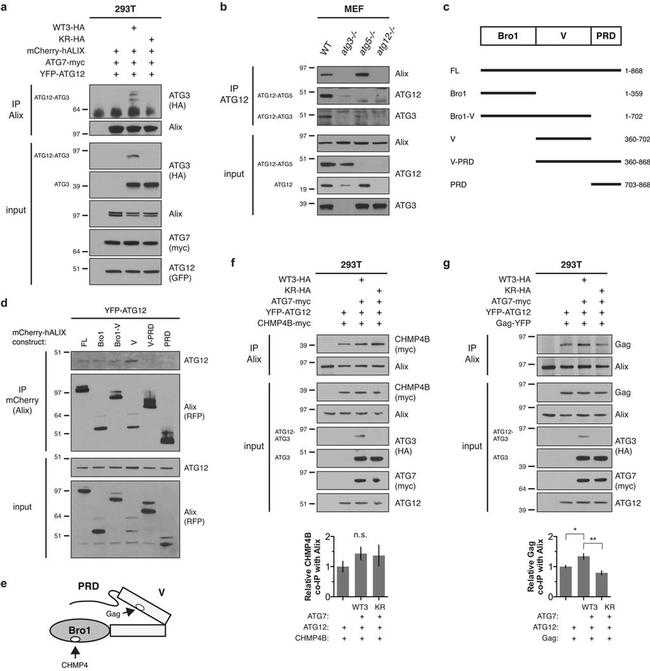
Figure 4 ATG12-ATG3 interacts with Alix (a) HEK293T cells were transfected with mCherry-hALIX, Myc-tagged ATG7 (ATG7-myc), YFP-ATG12, and HA-tagged wild-type ATG3 (WTATG3-HA) or mutant K243R ATG3 (KR-HA) as indicated. Lysates were immunoprecipitated with anti-Alix. Immune complexes (IP Alix) were resolved by SDS-PAGE and immunoblotted with anti-HA and anti-Alix. (b) MEFs with the indicated genotypes were lysed and immunoprecipitated with anti-ATG12. Immune complexes (IP ATG12) were resolved by SDS-PAGE and immunoblotted with anti-Alix, anti-ATG12, and anti-ATG3. (c) Schematic representation of the conserved structural domains in Alix and truncation mutants used in this study. Numbers represent the N- and C-terminal amino acid residues of deletion mutants. (d) HEK293T cells were transfected with YFP-ATG12 and the indicated mCherry-hALIX truncation mutants. Lysates were immunoprecipitated with anti-mCherry. Immune complexes (IP mCherry) were resolved by SDS-PAGE and immunoblotted with anti-RFP and anti-ATG12. (e) Schematic representation of the conserved structural domains and protein binding sites in Alix. (f) HEK293T cells were transfected with CHMP4B-myc, ATG7-myc, YFP-ATG12, and HA-tagged wild-type ATG3 (WTATG3-HA) or mutant K243R ATG3 (KR-HA) as indicated. Lysates were immunoprecipitated with anti-Alix. Immune complexes (IP Alix) were resolved by SDS-PAGE and immunoblotted with the indicated antibodies. Bottom: Quantification of co-immunoprecipitated CHMP4B (mean +- SEM; n