


 全部商品分类
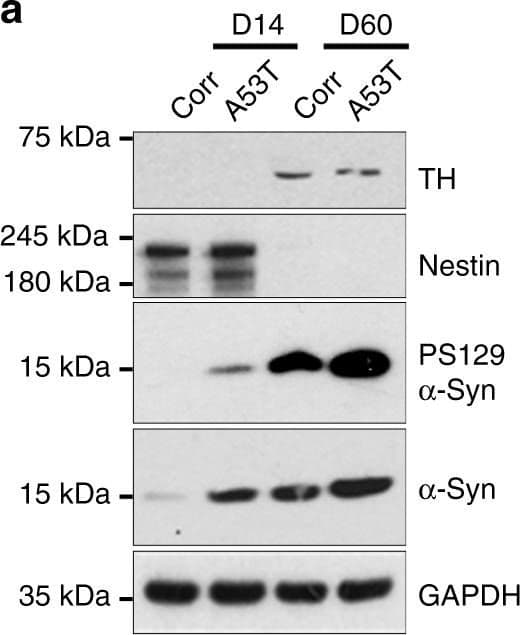


hNestin MAb (Cl 1969 (100 ug)


 下载产品说明书 下载SDS
 用小程序,查商品更便捷


 收藏
收藏
 对比
对比 咨询
咨询
Scientific Data
.") View Larger
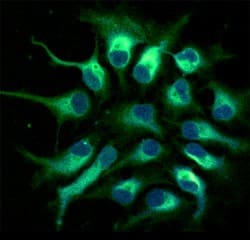
View LargerNestin in Human Neural Progenitor Cells. Nestin was detected in immersion fixed human fetal neural progenitor cells using 10 µg/mL Human Nestin Monoclonal Antibody (Catalog # MAB1259) for 3 hours at room temperature. Cells were stained (green) and counterstained with DAPI (blue). View our protocol for Fluorescent ICC Staining of Cells on Coverslips.
 View Larger
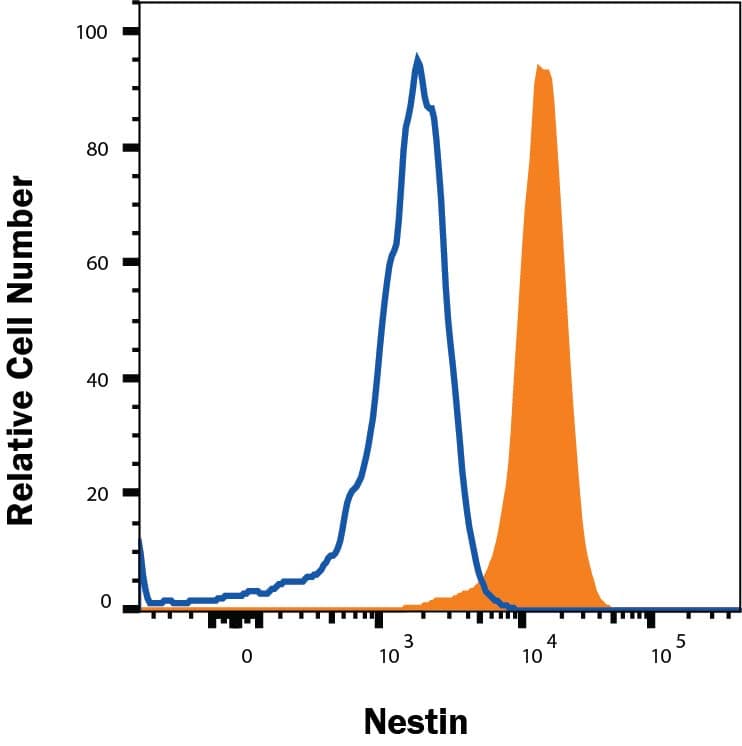
Detection of Nestin in A172 cells by Flow Cytometry. A172 cells were stained with Mouse Anti-Human Nestin Monoclonal Antibody (Catalog # MAB1259, filled histogram) or isotype control antibody (Catalog # MAB002, open histogram), followed by Phycoerythrin-conjugated Anti-Mouse IgG Secondary Antibody (Catalog # F0102B). To facilitate intracellular staining, cells were fixed and permeabilized with FlowX FoxP3 Fixation & Permeabilization Buffer Kit (Catalog # FC012). View our protocol for Staining Intracellular Molecules.
 View Larger
Detection of Mouse Nestin by Western Blot Cardiolipin is externalized to the mitochondrial surface in alpha -syn mutant hNs and transgenic mice in response to alpha -syn accumulation. a Western analysis of lysates from corrected and A53T cells at DIV 14 and DIV 60 labeled for total alpha -syn, PS129, TH (DA neuronal marker), nestin (NPC marker) or GAPDH show that levels of PS129-modified alpha -syn are elevated in A53T hNs at DIV 14 and remain elevated at DIV 60 relative to corrected cells. b, c Mitochondria were purified from A53T cells and genetically corrected cells at both DIV 14 and DIV 60. Lysates were then separated based on TX-100 solubility (soluble) or urea solubility (insoluble). Western analysis of A53T cells shows elevated soluble alpha -syn at the mitochondria relative to corrected cells at DIV 14 and DIV 60 (denoted by ** and * respectively). Quantification of soluble and insoluble alpha -syn levels in mitochondrial fractions normalized to Coomassie (c). Data represent mean ± s.e.m. *P < 0.05, **P < 0.01 by ANOVA followed by Tukey’s post hoc test, n = 4. d, e Micrographs of corrected and A53T-mutant NPCs expressing the negative charge probe RPRE-RFP and CL-GFP show RPRE-RFP translocation from a primarily plasma membrane localization in isogenic-corrected hNs to a punctate intracellular localization in A53T hNs in tight cellular localization with CL-GFP (d). Quantification of percent total cell number with colocalized RPRE-RFP and CL-GFP (e). Data represent mean ± s.e.m. **P < 0.0001 by t-test, n = 3 coverslips over 2 independent differentiations, DIV: 14; scale bar: 10 μm. f, g Fluorescence resonance energy transfer (FRET) from CL-GFP to RPRE-RFP in hiPSC-derived A53T and corrected hNs or hESC-derived WT, A53T and E46K hNs was assessed (f) and mean FRET intensity was quantified (g). Data represent mean ± s.e.m. **P < 0.01 by ANOVA followed by Tukey’s post hoc test, for hiPSCs, n = 6, for hESCs, n = 8 coverslips over two independent differentiations, DIV: 14. Scale bar: 10 µm. h Mitochondria were isolated from the SNpc of 6-month-old WT and A53T transgenic animals and labeled with Annexin V to measure the abundance of cardiolipin on the mitochondrial surface. Controls were rotenone-exposed WT samples. Animals were not randomized, nor was the analysis blinded. Data represent mean ± s.e.m. **P < 0.01 by ANOVA followed by Dunnett post hoc test, n = 4. Clipart was obtained at clker.com Image collected and cropped by CiteAb from the following publication (https://www.nature.com/articles/s41467-018-03241-9), licensed under a CC-BY license. Not internally tested by R&D Systems.
 View Larger
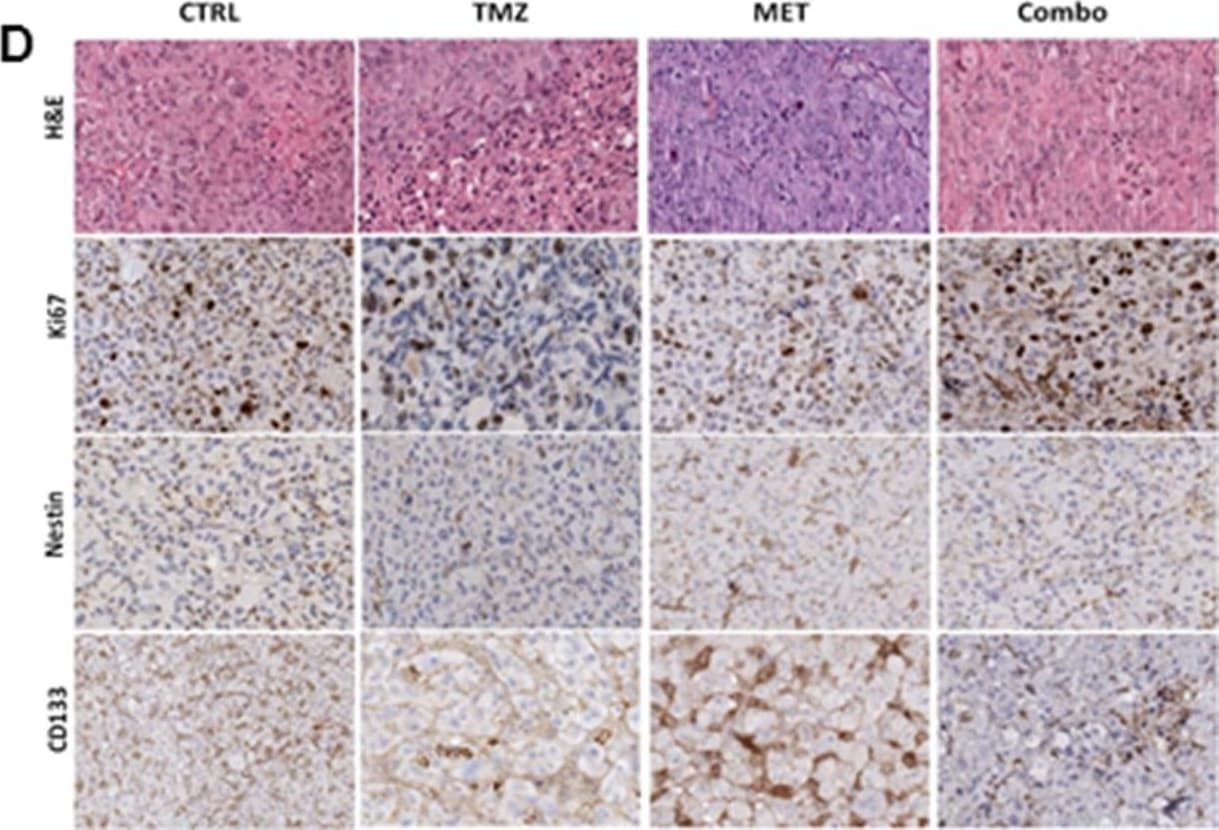
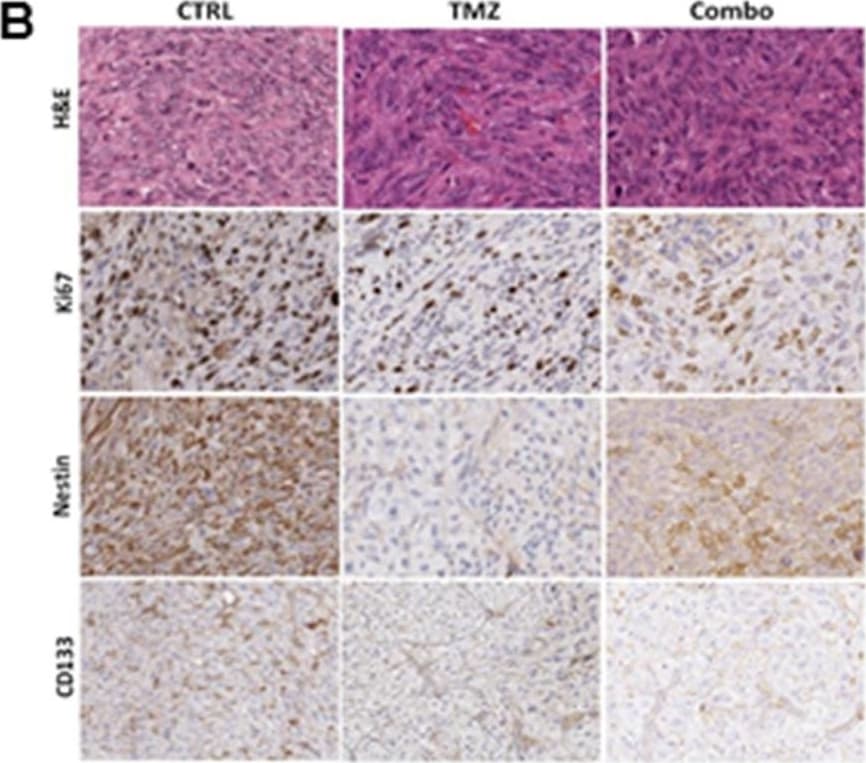
Detection of Human Nestin by Immunohistochemistry MET and TMZ effects in in vivo glioma models(A) Variation of U251 tumor volume measured at contrast-enhanced T1 MRI after treatment expressed as percentage of volume change. Error bars indicate SEM. (B) U251 derived orthotopic brain tumors from vehicle (CTRL), TMZ or TMZ/metformin (Combo) treated mice were analyzed for Ki67, Nestin and CD133 markers by immunohistochemistry. No difference between the tumor edge and bulk areas in IHC staining intensities or percentages of positive cells was observed for any of the investigated markers. H&E was performed for morphological evaluation of the tumors. Representative images are shown with original magnification x200. (C) Variation of T98G tumor volume measured using caliper after treatment expressed as percentage of volume variation. In T98G xenograft model already at 7 days, the combined treatment significantly slowed down tumor growth compared to control (p value = 0.005), moreover a transient reduction was observed with MET (p value = 0.03). After 3 weeks, only Combo-treated mice displayed tumor smaller than vehicle (p value = 0.04). Error bars indicate SEM. (D) T98G tumors from vehicle (CTRL), TMZ, MET or TMZ/metformin (Combo) treated mice, were analyzed for Ki67, Nestin and CD133 markers expression by immunohistochemistry. No difference between the tumor edge and bulk areas in IHC staining intensities or percentages of positive cells was observed for any of the investigated markers. Hematoxylin and eosin staining (H&E) was performed for morphological evaluation of the tumors. Representative images are shown with Original magnification x200. Image collected and cropped by CiteAb from the following publication (https://www.oncotarget.com/lookup/doi/10.18632/oncotarget.23028), licensed under a CC-BY license. Not internally tested by R&D Systems.
 View Larger
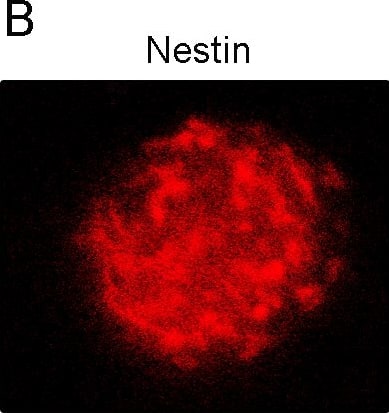
Detection of Rat Nestin by Immunocytochemistry/Immunofluorescence Neural stem cells could proliferate and differentiate into neurons and astrocytes.(A) Representative photomicrograph of neurospheres in culture. (B) Immunocytochemical staining of purified NSCs with Nestin. (C) Immunocytochemical staining of purified protoplasmic astrocytes with GFAP. (D) Immunocytochemical staining of purified neurons with beta -tubulin-III. (E) Nucleus staining of differentiated cells from NSCs with DAPI. Image collected and cropped by CiteAb from the following publication (https://pubmed.ncbi.nlm.nih.gov/26431046), licensed under a CC-BY license. Not internally tested by R&D Systems.
 View Larger
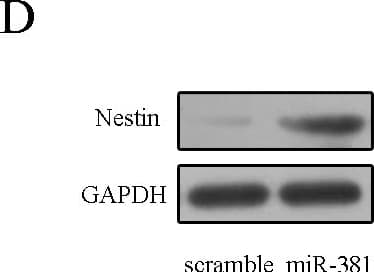
Detection of Rat Nestin by Western Blot miR–381 promoted neural stem cells proliferation.(A) The expression of miR–381 was measured by qRT-PCR. (B) CCK–8 was performed to detect the neural stem cells proliferation. (C) The mRNA expression of nestin was detected by qRT-PCR. (D) The protein expression of nestin was measured by Western blot. **p<0.01 and ***p<0.001. Image collected and cropped by CiteAb from the following publication (https://pubmed.ncbi.nlm.nih.gov/26431046), licensed under a CC-BY license. Not internally tested by R&D Systems.
 View Larger
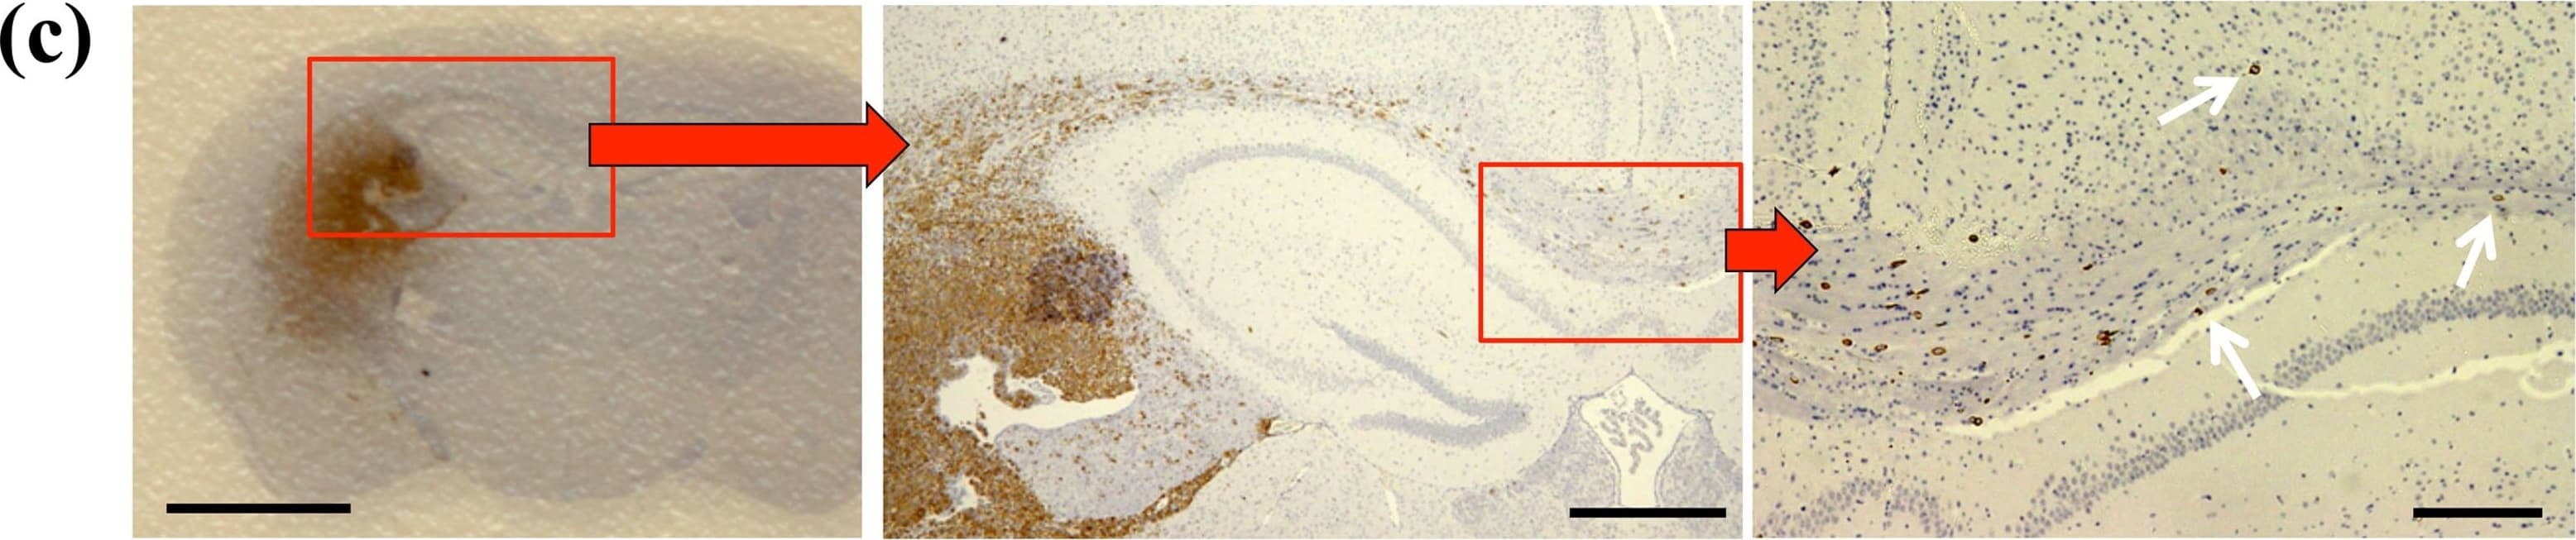
Detection of Mouse Nestin by Immunohistochemistry Dissimilar tumorigenesis in the in vivo animal model.(a) Kaplan-Meier survival plots; 3 mice were used for cells of each clone. (b) Representative brain tumors of NOD-SCID mice harboring xenografts of the clones #2 (upper left), #3 (lower left), #4 (upper right) and #5 (lower right); H.E. staining, arrows: tumor, scale bar = 5 mm. (c) A representative xenograft of the clone #4; nestin-positive cells infiltrated the contralateral hemisphere (arrows). Scale bars = 5 mm (left), 1 mm (middle), 50 μm (right). Image collected and cropped by CiteAb from the following publication (https://pubmed.ncbi.nlm.nih.gov/25623281), licensed under a CC-BY license. Not internally tested by R&D Systems.
Human Nestin Antibody Summary
Applications
Please Note: Optimal dilutions should be determined by each laboratory for each application. General Protocols are available in the Technical Information section on our website.
Background: Nestin
Nestin is a class VI intermediate filament protein (1, 2) that is expressed in stem cells of the central nervous system (CNS) (3) but not in mature CNS cells (4). Nestin expression is used extensively as a marker for CNS stem cells in the developing nervous system and in vitro cultured cells (5-10). Its transient expression is a critical step in the neural differentiation pathway (2). Nestin is also expressed in non-neural stem cell populations, such as pancreatic islet progenitors (11-13) and hematopoietic progenitors (14).
- Hockfield, S. and R.D. McKay (1985) J. Neurosci. 5:3310.
- Lendahl, U. et al. (1990) Cell 60:585.
- Frederiksen, K. and R.D. McKay (1988) J. Neurosci. 8:1144.
- Tohyama, T. et. al. (1992) Lab. Invest. 66:303.
- Uchida, N. et al. (2000) Proc. Natl. Acad.Sci. USA 97:14720.
- Frederiksen, K. et al. (1988) Neuron 1:439.
- Cattaneo, E. et al. (1990) Nature 347:762.
- Reynolds, B.A. and S. Weiss (1992) Science 255:1707.
- Rietze, R.L. et al. (2001) Nature 412:736.
- Carpenter, M.K. et al. (2001) Exp. Neurol 172:383.
- Zulewski, H. et al. (2001) Diabetes 50:521.
- Lumelsky, N. et al. (2001) Science 292:1389.
- Lechner, A. et al. (2002) Biochem.Biophys. Res. Commun. 293:670.
- Shih, C.C. et al. (2001) Blood 98:2412.
Preparation and Storage
- 12 months from date of receipt, -20 to -70 °C as supplied.
- 1 month, 2 to 8 °C under sterile conditions after reconstitution.
- 6 months, -20 to -70 °C under sterile conditions after reconstitution.
参考图片
Nestin in Human Neural Progenitor Cells. Nestin was detected in immersion fixed human fetal neural progenitor cells using 10 µg/mL Human Nestin Monoclonal Antibody (Catalog # MAB1259) for 3 hours at room temperature. Cells were stained (green) and counterstained with DAPI (blue). View our protocol for Fluorescent ICC Staining of Cells on Coverslips.