


 全部商品分类


hGATA-6 Aff Pur PAb (25 ug)


 下载产品说明书 下载SDS
 用小程序,查商品更便捷


 收藏
收藏
 对比
对比 咨询
咨询Immunohistochemistry(5-15 µg/mL)
Chromatin Immunoprecipitation (ChIP)(5 µg/5 x 106 cells)
Immunocytochemistry(5-15 µg/mL)

Met1-Thr449
Accession # Q92908
Scientific Data
 View Larger
Detection of Human GATA‑6 by Western Blot. Western blot shows cytoplasmic and nuclear extracts from PC-3 human prostate cancer cell line. PVDF membrane was probed with 1 µg/mL of Goat Anti-Human GATA-6 Antigen Affinity-purified Polyclonal Antibody (Catalog # AF1700) followed by HRP-conjugated Anti-Goat IgG Secondary Antibody (HAF017). A specific band was detected for GATA-6 at approximately 55 kDa (as indicated). This experiment was conducted under reducing conditions and using Immunoblot Buffer Group 1.
.") View Larger
View LargerGATA‑6 in KATO-III Human Cell Line. GATA-6 was detected in immersion fixed KATO-III human gastric carcinoma cell line using 10 µg/mL Goat Anti-Human GATA-6 Antigen Affinity-purified Polyclonal Antibody (Catalog # AF1700) for 3 hours at room temperature. Cells were stained with the NorthernLights™ 557-conjugated Anti-Goat IgG Secondary Antibody (red, upper panel; NL001) and counterstained with DAPI (blue, lower panel). View our protocol for Fluorescent ICC Staining of Cells on Coverslips.
 View Larger
Detection of GATA‑6-regulated Genes by Chromatin Immunoprecipitation. KATO-III human gastric carcinoma cell line was fixed using formaldehyde, resuspended in lysis buffer, and sonicated to shear chromatin. GATA-6/DNA complexes were immunoprecipitated using 5 µg Goat Anti-Human GATA-6 Antigen Affinity-purified Polyclonal Antibody (Catalog # AF1700) or control antibody (AB-108-C) for 15 minutes in an ultrasonic bath, followed by Biotinylated Anti-Goat IgG Secondary Antibody (BAF109). Immunocomplexes were captured using 50 µL of MagCellect Streptavidin Ferrofluid (MAG999) and DNA was purified using chelating resin solution. Themucin4promoter was detected by standard PCR.
.") View Larger
View LargerGATA‑6 in Human Intestine. GATA-6 was detected in immersion fixed paraffin-embedded sections of human intestine using Goat Anti-Human GATA-6 Antigen Affinity-purified Polyclonal Antibody (Catalog # AF1700) at 5 µg/mL overnight at 4 °C. Tissue was stained using the Anti-Goat HRP-DAB Cell & Tissue Staining Kit (brown; CTS008) and counter-stained with hematoxylin (blue). View our protocol for Chromogenic IHC Staining of Paraffin-embedded Tissue Sections.
 View Larger
Detection of Mouse GATA-6 by Immunocytochemistry/Immunofluorescence p38-Mapk14/11 inhibition during blastocyst maturation blocks PrE differentiation/maturation. (a) Experimental schema of p38-Mapk14/11 inhibition (+SB220025), plus vehicle control (+DMSO), and the details of antibodies used to analyse ICM cell lineage marker protein expression by immunofluorescence (IF) in late blastocysts (E4.5); Nanog and Gata4 (+DMSO n = 27, +SB220025 n = 33)—green, Nanog and Sox17 (+DMSO n = 18, +SB220025 n = 20)—red, and Nanog and Gata6 (+DMSO n = 24, +SB220025 n = 27)—blue. (b) Representative single confocal z-plane micrographs of vehicle control-treated (+DMSO) or p38-Mapk14/11 inhibited (+SB220025) late-blastocyst stage/equivalent embryos, immunofluorescently stained for indicated ICM cell lineage markers (Nanog in green and Gata4, Sox17 and Gata6 in red, plus DAPI DNA stain in blue). Examples of cells classified as TE, PrE and EPI are marked with an asterisk, arrowhead and arrow, respectively. Scale bar, 15 µm. (c) Pie charts of the relative cell lineage contribution in vehicle control (+DMSO) and p38-Mapk14/11 inhibited (+SB220025) blastocysts as judged by IF to detect the stated ICM lineage marker proteins. Blue, trophectoderm (TE); yellow, epiblast (EPI—ICM exhibiting exclusive Nanog expression); green, primitive endoderm (PrE—ICM exhibiting exclusive Gata4/6 or Sox17 expression, as appropriate); orange, uncommitted ICM cells (exhibiting co-expression of both Nanog and Gata4/6 or Sox17, as appropriate); and grey, ICM cells negative for either assayed marker. (d) Bar charts show average number of cells allocated to each specified ICM lineage, as judged by the indicated IF staining regime employed. Error bars represent s.e.m. and asterisks denote statistical significant differences in cell number between the vehicle control (+DMSO, black bars) and p38-Mapk14/11 inhibited (+SB220025, grey bars) embryo groups, according to two-tailed Student's t-test, with *p < 0.05 and **p < 0.005 confidence intervals. Yellow asterisk denotes increase in cells positively immunofluorescently staining for both EPI and PrE ICM markers using anti-Nanog and anti-Gata6 (an early PrE marker) antibodies. All individual embryo data used in the preparation of this figure are contained within the electronic supplementary material, table S3. Image collected and cropped by CiteAb from the following publication (https://pubmed.ncbi.nlm.nih.gov/27605380), licensed under a CC-BY license. Not internally tested by R&D Systems.
 View Larger
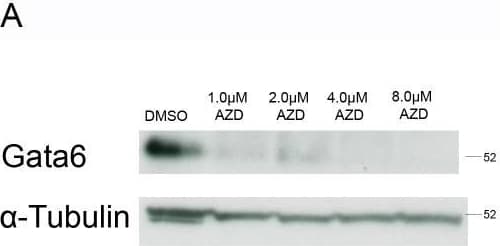
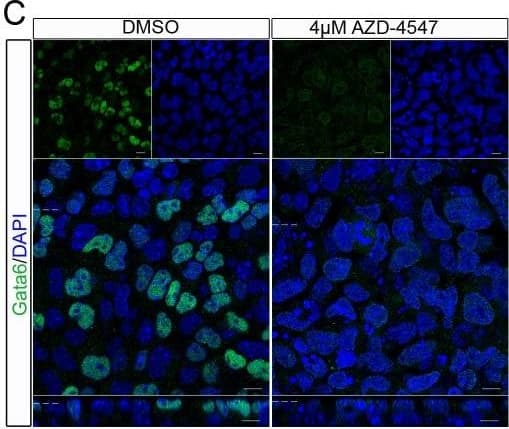
Detection of Mouse GATA-6 by Western Blot Reduced expression of the primitive endoderm markers Gata4 and Gata6 and increased expression of Nanog was observed in embryoid bodies following inhibitor of the Fgfr.Embryoid bodies were grown in different concentrations of AZD-4547 or 0.08% DMSO for 7 days. Expression levels of (A) Gata6, and (B) Gata4 were analysed using western blotting. A representative blot and quantification from 3 independent experiments is shown for each marker. A dose dependent decrease in expression of both proteins was observed. Statistical analysis is a one-way Anova with a Dunnett’s post-hoc test. Whole-mount immunostaining of (C) Gata6 and (D) Nanog after treatment of embryoid bodies with 4 µM AZD-4547 or 0.04% DMSO. A reduction in the percentage of nuclei expressing Gata6 was observed. The percentage of nuclei expressing Nanog increased. A representative image from 3 independent experiments is shown. Scale bars 10 µm. Dotted lines represent position that the relevant orthogonal or aerial images were taken. Statistical analysis is a paired t-test. Data is from 3 independent experiments, error bars represent SEM. (*P = 0.1–0.5, **p = 0.001–0.01, ***p<0.001). Image collected and cropped by CiteAb from the following publication (https://dx.plos.org/10.1371/journal.pone.0095434), licensed under a CC-BY license. Not internally tested by R&D Systems.
 View Larger
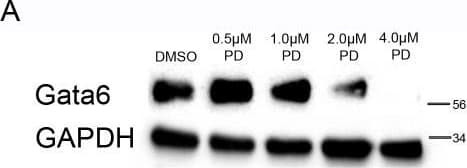
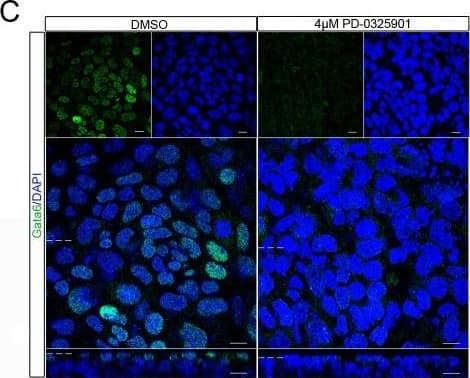
Detection of Mouse GATA-6 by Western Blot Reduced expression of primitive endoderm markers Gata4 and Gata6 and increased expression of Nanog was observed in embryoid bodies upon inhibition of Mek.Embryoid bodies were grown in different concentrations of PD-0325901 or 0.04% DMSO for 7 days. Expression levels of (A) Gata6, and (B) Gata4 were analysed using western blotting. A representative blot and quantification from 3 independent experiments is shown for each marker. A dose dependent decrease in expression of both proteins was observed. Statistical analysis is a one-way Anova with a Dunnett’s post-hoc test. Whole-mount immunostaining of (C) Gata6 and (D) Nanog after treatment of embryoid bodies with 4 µM PD-0325901. A reduction in the percentage of nuclei expressing Gata6 was observed whilst there was an increase in the percentage of nuclei expressing Nanog. A representative image from 3 independent experiments is shown. Scale bars 10 µm. Dotted lines represent position that the relevant orthogonal or aerial images were taken. Statistical test is a paired t-test. Data is from 3 independent experiments, error bars represent SEM. (*P = 0.1–0.5, **p = 0.001–0.01, ***p<0.001). Image collected and cropped by CiteAb from the following publication (https://dx.plos.org/10.1371/journal.pone.0095434), licensed under a CC-BY license. Not internally tested by R&D Systems.
 View Larger
Detection of Mouse GATA-6 by Immunocytochemistry/Immunofluorescence Reduced expression of the primitive endoderm markers Gata4 and Gata6 and increased expression of Nanog was observed in embryoid bodies following inhibitor of the Fgfr.Embryoid bodies were grown in different concentrations of AZD-4547 or 0.08% DMSO for 7 days. Expression levels of (A) Gata6, and (B) Gata4 were analysed using western blotting. A representative blot and quantification from 3 independent experiments is shown for each marker. A dose dependent decrease in expression of both proteins was observed. Statistical analysis is a one-way Anova with a Dunnett’s post-hoc test. Whole-mount immunostaining of (C) Gata6 and (D) Nanog after treatment of embryoid bodies with 4 µM AZD-4547 or 0.04% DMSO. A reduction in the percentage of nuclei expressing Gata6 was observed. The percentage of nuclei expressing Nanog increased. A representative image from 3 independent experiments is shown. Scale bars 10 µm. Dotted lines represent position that the relevant orthogonal or aerial images were taken. Statistical analysis is a paired t-test. Data is from 3 independent experiments, error bars represent SEM. (*P = 0.1–0.5, **p = 0.001–0.01, ***p<0.001). Image collected and cropped by CiteAb from the following publication (https://dx.plos.org/10.1371/journal.pone.0095434), licensed under a CC-BY license. Not internally tested by R&D Systems.
 View Larger
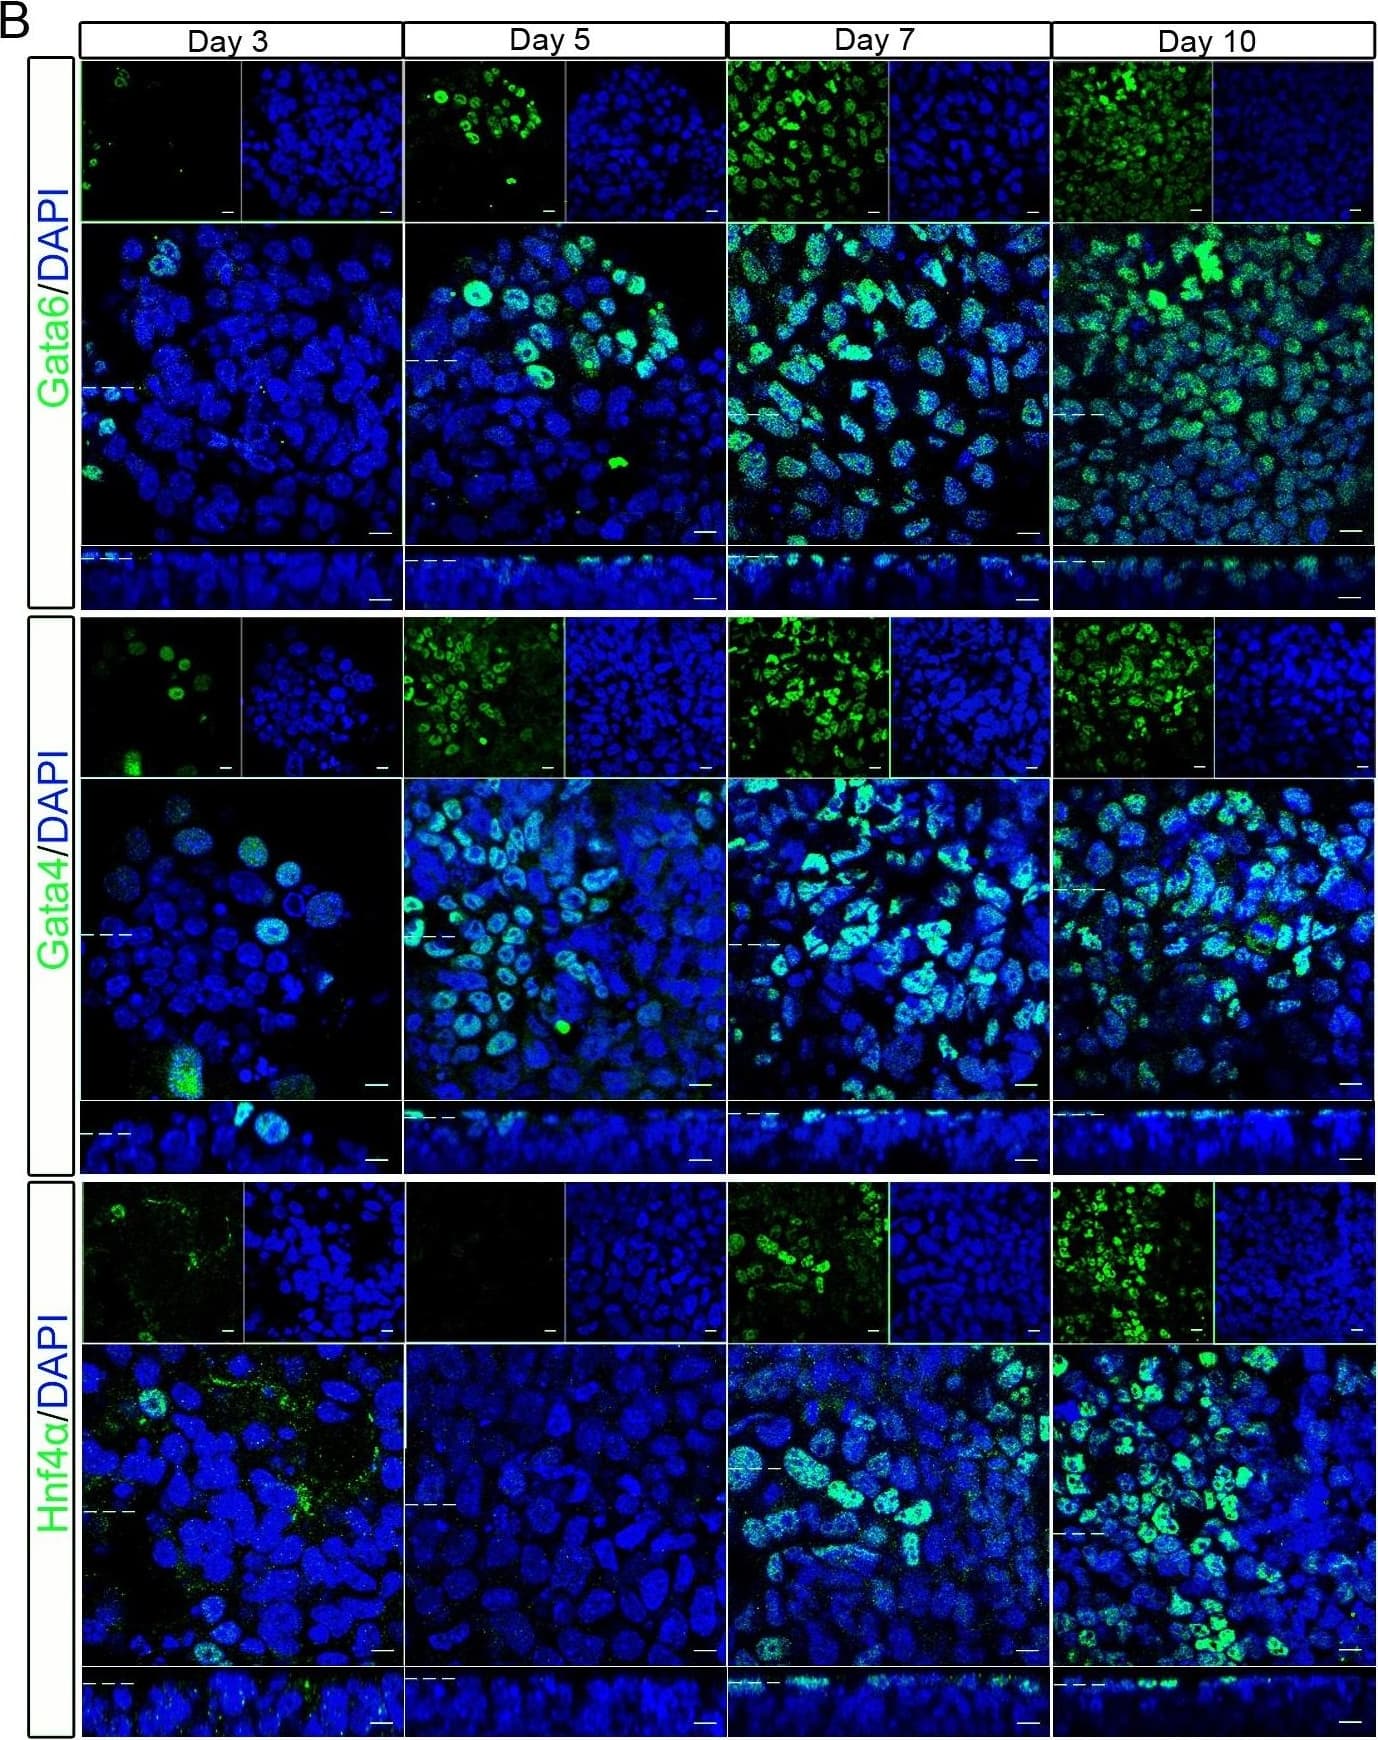
Detection of Mouse GATA-6 by Immunocytochemistry/Immunofluorescence expression of primitive endoderm cell fate markers gradually increased and nanog decreased in developing embryoid bodies.Embryoid bodies were produced from R63 mES cells using the hanging drop method. Development of the embryoid body was monitored over ten days. (A) Light microscopy images show the gradual increase in size of the embryoid bodies as well as increased heterogeneity, loss of circularity and formation of cystic cavities at later timepoints. Scale bars 200 µm. (B) Whole-mount immunostaining showing nuclear localisation of Gata6, Gata4, and Hnf4 alpha on days 3, 5, 7, and 10 of embryoid body development. The percentage of positive nuclei for each protein is shown graphically. The number of positive nuclei increased, reaching a maximum on day 7. (C) Whole-mount immunostaining showing nuclear localisation of Nanog. The number of positive nuclei rapidly decreased, with no positive cells seen on days 7 or 10. The percentage of positive nuclei for each protein is shown graphically. Data is from at least 3 independent experiments, error bars are standard error of the mean (SEM). Statistical analysis is a one-way Anova with a Tukey’s post-hoc test, (*P = 0.1–0.5, **p = 0.001–0.01, ***p<0.001). Dotted lines represent position that the relevant orthogonal or aerial images were taken. Scale bars 10 µm. Image collected and cropped by CiteAb from the following publication (https://dx.plos.org/10.1371/journal.pone.0095434), licensed under a CC-BY license. Not internally tested by R&D Systems.
 View Larger
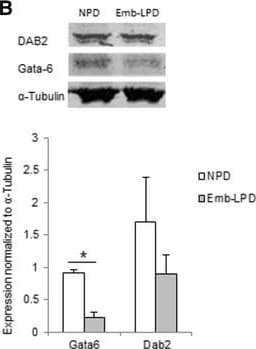
Detection of Mouse GATA-6 by Western Blot Gata factor expression in embryoid bodies (EBs) at day 5.5 culture and in ex vivo visceral yolk sac (VYS) at E17.5 in relation to maternal diet. (A) Expression of Gata4, Gata6 and Dab2 mRNA in EBs of Emb-LPD and NPD groups presented as ratio to the geometric mean of Gapdh and Ppib transcripts (n = 5 per treatment). (B) Expression of Gata6 and Dab2 protein in EBs from NPD and Emb-LPD groups (n = 6 cell lines per treatment). Upper: representative images of protein immunoblot bands. Lower: band intensity normalized to alpha -tubulin expression. (C) Expression of Gata6 protein in VYS from Emb-LPD, LPD and NPD group (n = 4 samples per treatment). Upper: representative images of protein immunoblot bands. Lower: band intensity normalized to alpha -tubulin expression. Values presented are mean ± SEM. *p < 0.05. Image collected and cropped by CiteAb from the following publication (https://bmcdevbiol.biomedcentral.com/articles/10.1186/s12861-015-0053-1), licensed under a CC-BY license. Not internally tested by R&D Systems.
 View Larger
Detection of Mouse GATA-6 by Immunocytochemistry/Immunofluorescence Reduced expression of primitive endoderm markers Gata4 and Gata6 and increased expression of Nanog was observed in embryoid bodies upon inhibition of Mek.Embryoid bodies were grown in different concentrations of PD-0325901 or 0.04% DMSO for 7 days. Expression levels of (A) Gata6, and (B) Gata4 were analysed using western blotting. A representative blot and quantification from 3 independent experiments is shown for each marker. A dose dependent decrease in expression of both proteins was observed. Statistical analysis is a one-way Anova with a Dunnett’s post-hoc test. Whole-mount immunostaining of (C) Gata6 and (D) Nanog after treatment of embryoid bodies with 4 µM PD-0325901. A reduction in the percentage of nuclei expressing Gata6 was observed whilst there was an increase in the percentage of nuclei expressing Nanog. A representative image from 3 independent experiments is shown. Scale bars 10 µm. Dotted lines represent position that the relevant orthogonal or aerial images were taken. Statistical test is a paired t-test. Data is from 3 independent experiments, error bars represent SEM. (*P = 0.1–0.5, **p = 0.001–0.01, ***p<0.001). Image collected and cropped by CiteAb from the following publication (https://dx.plos.org/10.1371/journal.pone.0095434), licensed under a CC-BY license. Not internally tested by R&D Systems.
 View Larger
Detection of Human GATA-6 by Western Blot Gata factor expression in embryoid bodies (EBs) at day 5.5 culture and in ex vivo visceral yolk sac (VYS) at E17.5 in relation to maternal diet. (A) Expression of Gata4, Gata6 and Dab2 mRNA in EBs of Emb-LPD and NPD groups presented as ratio to the geometric mean of Gapdh and Ppib transcripts (n = 5 per treatment). (B) Expression of Gata6 and Dab2 protein in EBs from NPD and Emb-LPD groups (n = 6 cell lines per treatment). Upper: representative images of protein immunoblot bands. Lower: band intensity normalized to alpha -tubulin expression. (C) Expression of Gata6 protein in VYS from Emb-LPD, LPD and NPD group (n = 4 samples per treatment). Upper: representative images of protein immunoblot bands. Lower: band intensity normalized to alpha -tubulin expression. Values presented are mean ± SEM. *p < 0.05. Image collected and cropped by CiteAb from the following publication (https://bmcdevbiol.biomedcentral.com/articles/10.1186/s12861-015-0053-1), licensed under a CC-BY license. Not internally tested by R&D Systems.
Human GATA-6 Antibody Summary
Met1-Thr449
Accession # Q92908
Applications
Please Note: Optimal dilutions should be determined by each laboratory for each application. General Protocols are available in the Technical Information section on our website.
Immunohistochemistry(5-15 µg/mL)
Chromatin Immunoprecipitation (ChIP)(5 µg/5 x 106 cells)
Immunocytochemistry(5-15 µg/mL)
Background: GATA-6
GATA-6 (also named GATA-GT1) is a zinc finger transcription activating protein that bins to a T/A-G-A-T-A-G/A DNA sequence motif in mesodermally and endodermally-derived tissue. There are two GATA-6 isoforms that arise from alternate start sites: a short form of 449 amino acids (aa), and a long form of 595 aa. The short form of human GATA-6 is 93%, 92% and 88% aa identical to GATA-6 in porcine, rat and mouse, respectively.
Preparation and Storage
- 12 months from date of receipt, -20 to -70 °C as supplied.
- 1 month, 2 to 8 °C under sterile conditions after reconstitution.
- 6 months, -20 to -70 °C under sterile conditions after reconstitution.
参考图片
Detection of GATA‑6-regulated Genes by Chromatin Immunoprecipitation. KATO‑III human gastric carcinoma cell line was fixed using formaldehyde, resuspended in lysis buffer, and sonicated to shear chromatin. GATA‑6/DNA complexes were immunoprecipitated using 5 μg Goat Anti-Human GATA‑6 Antigen Affinity-purified Polyclonal Antibody (Catalog # AF1700) or control antibody (Catalog # AB-108-C) for 15 minutes in an ultrasonic bath, followed by Biotinylated Anti-Goat IgG Secondary Antibody (Catalog # BAF109). Immunocomplexes were captured using 50 μL of MagCellect Streptavidin Ferrofluid (Catalog # MAG999) and DNA was purified using chelating resin solution. The mucin4 promoter was detected by standard PCR.
GATA‑6 in KATO-III Human Cell Line. GATA‑6 was detected in immersion fixed KATO-III human gastric carcinoma cell line using 10 µg/mL Goat Anti-Human GATA‑6 Antigen Affinity-purified Polyclonal Antibody (Catalog # AF1700) for 3 hours at room temperature. Cells were stained with the NorthernLights™ 557-conjugated Anti-Goat IgG Secondary Antibody (red, upper panel; Catalog # NL001) and counterstained with DAPI (blue, lower panel). View our protocol for Fluorescent ICC Staining of Cells on Coverslips.
GATA‑6 in Human Intestine. GATA‑6 was detected in immersion fixed paraffin-embedded sections of human intestine using Goat Anti-Human GATA‑6 Antigen Affinity-purified Polyclonal Antibody (Catalog # AF1700) at 5 µg/mL overnight at 4 °C. Tissue was stained using the Anti-Goat HRP-DAB Cell & Tissue Staining Kit (brown; Catalog # CTS008) and counterstained with hematoxylin (blue). View our protocol for Chromogenic IHC Staining of Paraffin-embedded Tissue Sections.