


 全部商品分类
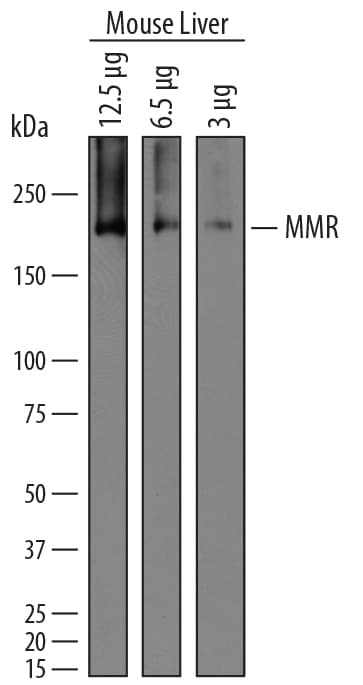


mMMR Aff Pur PAb (25 ug)


 下载产品说明书 下载SDS
 用小程序,查商品更便捷


 收藏
收藏
 对比
对比 咨询
咨询Flow Cytometry(0.25 µg/106 cells)
Immunohistochemistry(5-15 µg/mL)

Leu19-Ala1388
Accession # Q2HZ94
Scientific Data
 View Larger
Detection of Mouse MMR/CD206 by Western Blot. Western blot shows lysates of mouse liver tissue. Gels were loaded with 12 µg, 6.5 µg, and 3 µg of tissue lysate. PVDF membrane was probed with 1 µg/mL of Goat Anti-Mouse MMR/CD206 Antigen Affinity-purified Polyclonal Antibody (Catalog # AF2535) followed by HRP-conjugated Anti-Goat IgG Secondary Antibody (Catalog # HAF019). A specific band was detected for MMR/CD206 at approximately 180 kDa (as indicated). This experiment was conducted under reducing conditions and using Immunoblot Buffer Group 1.
.") View Larger
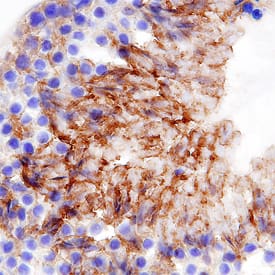
View LargerMMR/CD206 in Mouse Testis. MMR/CD206 was detected in perfusion fixed frozen sections of mouse testis using Goat Anti-Mouse MMR/CD206 Antigen Affinity-purified Polyclonal Antibody (Catalog # AF2535) at 5 µg/mL overnight at 4 °C. Tissue was stained using the Anti-Goat HRP-DAB Cell & Tissue Staining Kit (brown; Catalog # CTS008) and counterstained with hematoxylin (blue). Specific staining was localized to spermatocytes in testis. View our protocol for Chromogenic IHC Staining of Frozen Tissue Sections.
.") View Larger
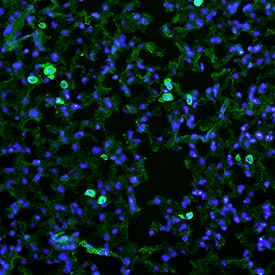
View LargerMMR/CD206 in Mouse Lung. MMR/CD206 was detected in perfusion fixed frozen sections of mouse lung using Goat Anti-Mouse MMR/CD206 Antigen Affinity-purified Polyclonal Antibody (Catalog # AF2535) at 25 µg/mL overnight at 4 °C. Tissue was stained using the NorthernLights™ 493-conjugated Anti-Goat IgG Secondary Antibody (green; Catalog # NL003) and counterstained with DAPI (blue). Specific staining was localized to cytoplasm of macrophages. View our protocol for Fluorescent IHC Staining of Frozen Tissue Sections.
 View Larger
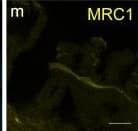
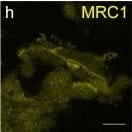
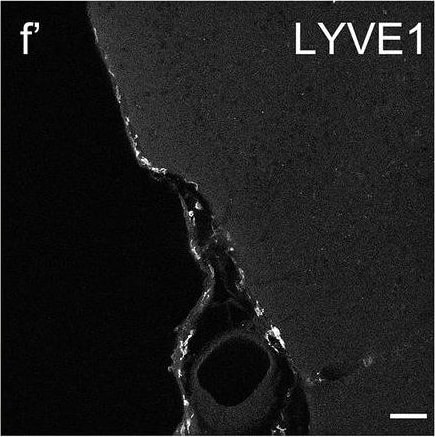
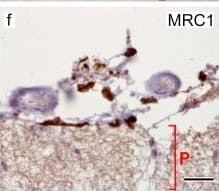
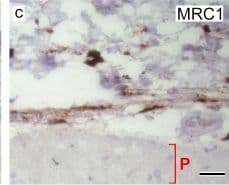
Detection of Human MMR/CD206/Mannose Receptor by Immunocytochemistry/Immunofluorescence Cells of human meninges co-express LLEC markers. a–c DAB-IHC with single antibodies detects VEGFR3 (a), LYVE1 (b), and MRC1 (c) in the meninges of human post mortem brain showing no signs of neuropathology. These images are taken from a 38 year old male (sample P17/07, Table 1), and confirmed in n = 2 additional samples. P parenchyma. Scale = 150 µm (a); 40 µm (b); and 20 µm (c). d–f DAB-IHC with single antibodies detects VEGFR3 (b), LYVE1 (c), and MRC1 (d) in elderly human meninges (age: 89–92) with evidence of neuropathology and confirmed in n = 3 brains (Table 1). P, parenchyma. Scale = 20 µm. g–p IHC with fluorescent antibodies detects human meningeal cells that co-express MRC1 (h, m, yellow), LYVE1 (i, n, white), and VEGFR3 (j, o, green). Nuclei/RNA are labelled with DAPI (g, l, blue) and images are merged in (k, p). Scale = 10 µm Image collected and cropped by CiteAb from the following publication (https://pubmed.ncbi.nlm.nih.gov/31696318), licensed under a CC-BY license. Not internally tested by R&D Systems.
 View Larger
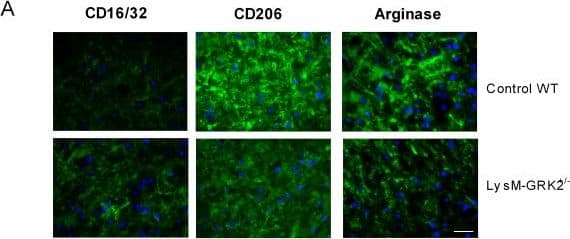
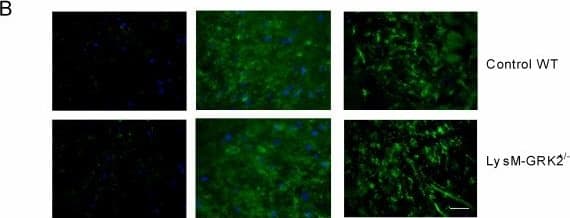
Detection of Mouse MMR/CD206/Mannose Receptor by Immunocytochemistry/Immunofluorescence M1 and M2 phenotype in spinal cord after intraplantar IL-1 beta. Wild-type (WT) and LysM-G protein–coupled receptor kinase (GRK)2+/− mice received an intraplantar injection of 1 ng IL-1 beta. At 15 hours after injection, spinal cord was collected, and frozen sections of (A) lumbar spinal cord (L2 to L5) and as control (B) thoracic spinal cord (T6 to T10) were stained for M1 (CD16/32) and M2 (CD206 and arginase-I) phenotypic markers. A representative example of M1 and M2 staining in the dorsal horn of one of the four mice per group is displayed. Scale bar indicates 20 μm. (C) Quantification of microglia/macrophages expressing M1 and M2 phenotypic markers in spinal cord from WT and LysM-GRK2+/− mice. Expression was quantified in approximately 10 to 15 dorsal horns of spinal cords per group (4 mice per group). The level of expression in the lumbar or thoracic area from control WT mice was set at 100%. Data are expressed as means ± SEM. **P < 0.01, ***P < 0.001. Image collected and cropped by CiteAb from the following publication (https://pubmed.ncbi.nlm.nih.gov/22731384), licensed under a CC-BY license. Not internally tested by R&D Systems.
 View Larger
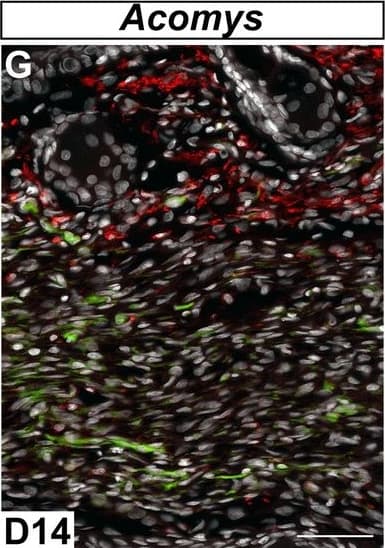
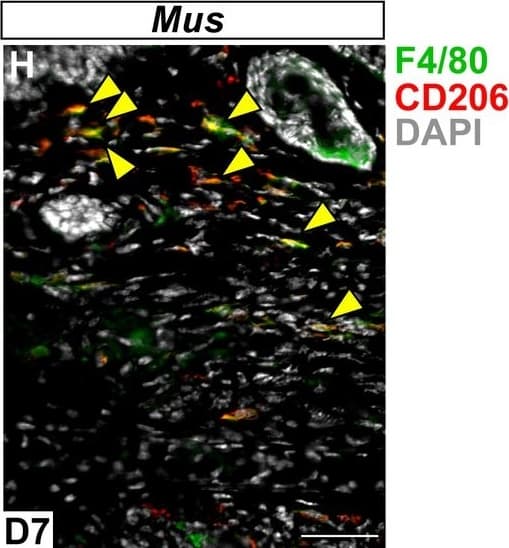
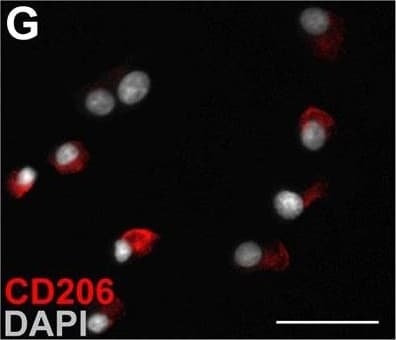
Detection of Mouse MMR/CD206/Mannose Receptor by Immunocytochemistry/Immunofluorescence Immunofluorescent staining for macrophage marker F4/80 in Acomys and Mus.(A–C) Bone-marrow-derived cells isolated from Acomys and stained for F4/80 (green). (A) unstimulated cells, (B) cells stimulated with IFN gamma and LPS, (C) cells stimulated with IL-4. (D–F) Bone-marrow-derived cells isolated from Mus and stained for F4/80 (green). (D) unstimulated cells, (E) cells stimulated with IFN gamma and LPS, and (F) cells stimulated with IL-4. Scale bar = 50 μm. (G) Acomys ear tissue at D15 after injury stained for F4/80 (green), CD206 (red) and DAPI (grey). (H) Mus ear tissue at D7 after injury stained for F4/80 (green), CD206 (red) and DAPI (grey). Scale bar = 50 μm.DOI:https://dx.doi.org/10.7554/eLife.24623.012 Image collected and cropped by CiteAb from the following publication (https://pubmed.ncbi.nlm.nih.gov/28508748), licensed under a CC-BY license. Not internally tested by R&D Systems.
 View Larger
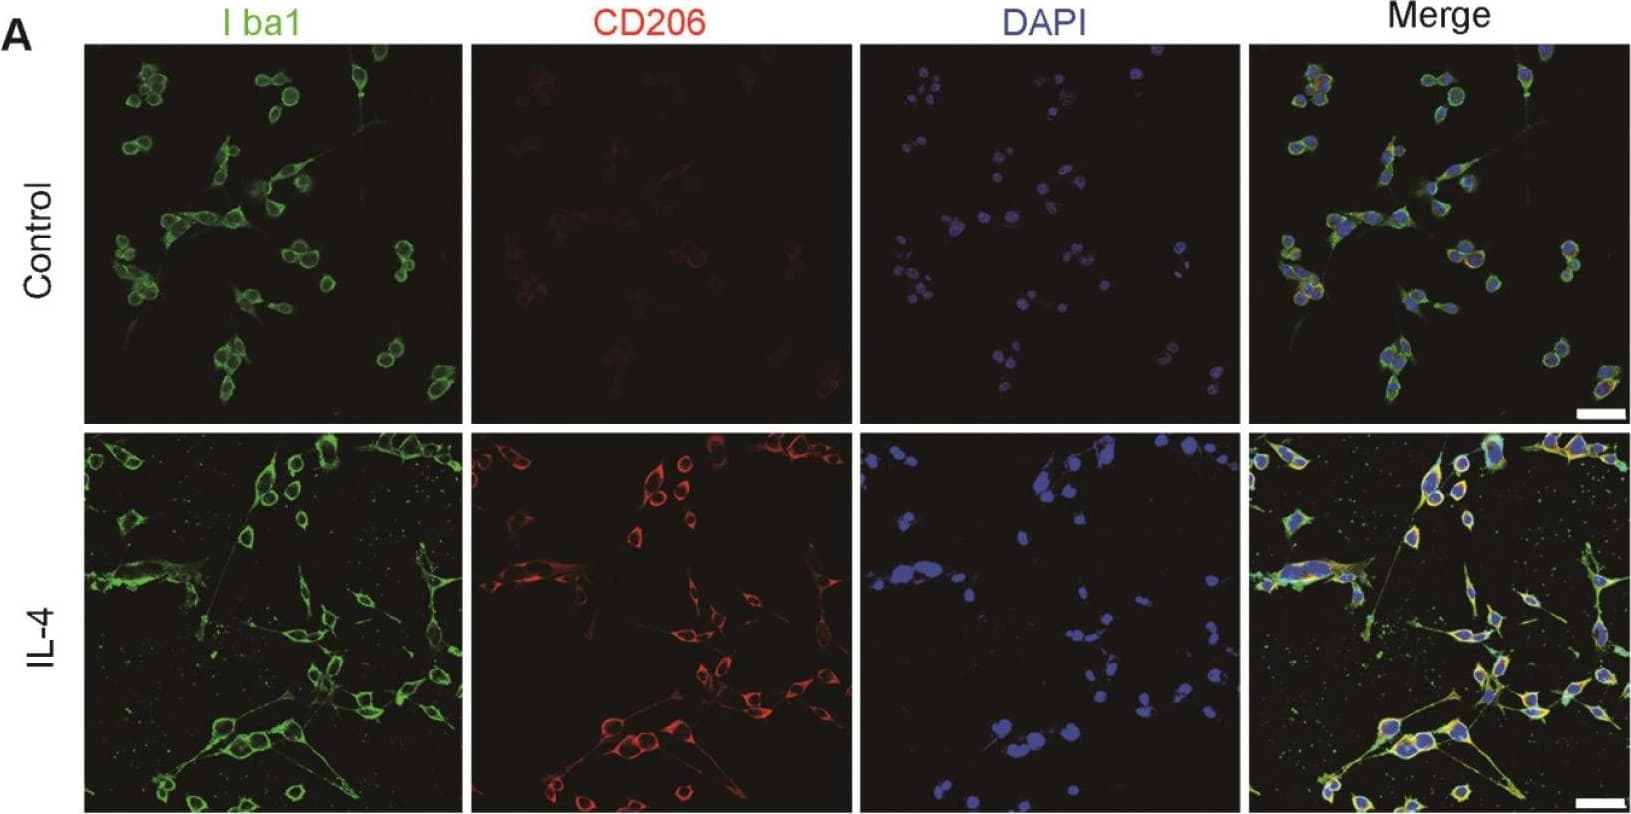
Detection of Mouse MMR/CD206/Mannose Receptor by Immunohistochemistry Characterization of M2 BV2 cells induced by IL-4 and identification of sEVs derived from M2 BV2 cells. (A, B) Representative images of BV2 cells immunostained for Iba-1 (green), CD206 (red), and arginase (red). Cultured systems were treated with 0 or 20 ng/µL IL-4. Cell nuclei were counterstained with DAPI. Scale bar = 50 µm. (C) Western blotting analysis of CD206 and arginase expression in BV2 cells after 0 or 20 ng/µL IL-4 treatment. (D) Representative electron microscopy images showing the phenotype of M2-sEVs. Left image scale bar = 100 nm, right image scale bar = 50 nm. (F) NTA of M2-sEVs isolated by ultracentrifugation from M2 BV2 cells. Data represent the average size distribution profile of three samples and each purification normalized to the total nanoparticle concentrations. Data for each sample was derived from three different videos and analyses. (G) Western blotting analysis of TSG101 and CD63 levels in M2 BV2 cells and M2-sEVs. Image collected and cropped by CiteAb from the following publication (https://pubmed.ncbi.nlm.nih.gov/33391532), licensed under a CC-BY license. Not internally tested by R&D Systems.
 View Larger
Detection of Human MMR/CD206/Mannose Receptor by Immunocytochemistry/Immunofluorescence Cells of human meninges co-express LLEC markers. a–c DAB-IHC with single antibodies detects VEGFR3 (a), LYVE1 (b), and MRC1 (c) in the meninges of human post mortem brain showing no signs of neuropathology. These images are taken from a 38 year old male (sample P17/07, Table 1), and confirmed in n = 2 additional samples. P parenchyma. Scale = 150 µm (a); 40 µm (b); and 20 µm (c). d–f DAB-IHC with single antibodies detects VEGFR3 (b), LYVE1 (c), and MRC1 (d) in elderly human meninges (age: 89–92) with evidence of neuropathology and confirmed in n = 3 brains (Table 1). P, parenchyma. Scale = 20 µm. g–p IHC with fluorescent antibodies detects human meningeal cells that co-express MRC1 (h, m, yellow), LYVE1 (i, n, white), and VEGFR3 (j, o, green). Nuclei/RNA are labelled with DAPI (g, l, blue) and images are merged in (k, p). Scale = 10 µm Image collected and cropped by CiteAb from the following publication (https://pubmed.ncbi.nlm.nih.gov/31696318), licensed under a CC-BY license. Not internally tested by R&D Systems.
 View Larger
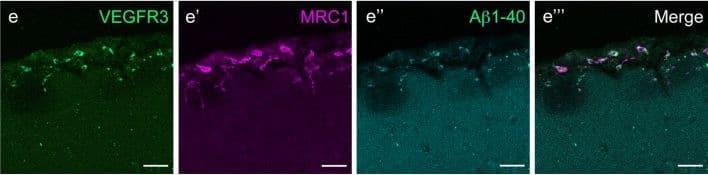
Detection of Mouse MMR/CD206/Mannose Receptor by Immunocytochemistry/Immunofluorescence Mouse LLECs take up A beta 1-40. a Schematic showing the site of dye and A beta 1-40 perfusion into the CSF via the cisterna magna (arrow) of a 2-month old mouse. The dotted line indicates the plane of section. A anterior, P posterior, D dorsal, V ventral. b Coronal brain section indicating the areas imaged. SF4 refers to area captured in Figure S4. c The percentage of each labelled cell type that internalized perfused A beta. Cells co-expressing VEGFR3 and LYVE1 take up A beta at a higher rate than MRC1, LYVE1 double-positive cells as well as MRC1-positive, LYVE1-negative cells (p ≤ 0.05, bootstrap). VEGFR3, LYVE1 counts, n = 2 brains (3 sections/brain). MRC1, LYVE1 counts, n = 3 brains (3 sections/brain). d–d′′′ Cells of the adult mouse meninges that co-express VEGFR3 (d, green) and LYVE1 (d′, white) internalize A beta 1-40 (d′′, cyan). Scale = 20 µm. e-e′′′) Cells of the adult mouse meninges that co-express VEGFR3 (e, green) and MRC1 (e′, white) internalize A beta 1-40 (e′′, cyan). Scale = 40 µm. f–f′′′) Cells of the adult mouse meninges that co-express MRC1 (f, magenta) and LYVE1 (f′, white) internalize A beta 1-40 (f′′, cyan). The walls of a blood vessel (white arrowhead, f′′) also accumulate A beta 1-40. Scale = 60 µm Image collected and cropped by CiteAb from the following publication (https://pubmed.ncbi.nlm.nih.gov/31696318), licensed under a CC-BY license. Not internally tested by R&D Systems.
 View Larger
Detection of Human MMR/CD206/Mannose Receptor by Immunocytochemistry/Immunofluorescence Cells of human meninges co-express LLEC markers. a–c DAB-IHC with single antibodies detects VEGFR3 (a), LYVE1 (b), and MRC1 (c) in the meninges of human post mortem brain showing no signs of neuropathology. These images are taken from a 38 year old male (sample P17/07, Table 1), and confirmed in n = 2 additional samples. P parenchyma. Scale = 150 µm (a); 40 µm (b); and 20 µm (c). d–f DAB-IHC with single antibodies detects VEGFR3 (b), LYVE1 (c), and MRC1 (d) in elderly human meninges (age: 89–92) with evidence of neuropathology and confirmed in n = 3 brains (Table 1). P, parenchyma. Scale = 20 µm. g–p IHC with fluorescent antibodies detects human meningeal cells that co-express MRC1 (h, m, yellow), LYVE1 (i, n, white), and VEGFR3 (j, o, green). Nuclei/RNA are labelled with DAPI (g, l, blue) and images are merged in (k, p). Scale = 10 µm Image collected and cropped by CiteAb from the following publication (https://pubmed.ncbi.nlm.nih.gov/31696318), licensed under a CC-BY license. Not internally tested by R&D Systems.
 View Larger
Detection of Mouse MMR/CD206/Mannose Receptor by Immunocytochemistry/Immunofluorescence Immunofluorescent staining for macrophage marker F4/80 in Acomys and Mus.(A–C) Bone-marrow-derived cells isolated from Acomys and stained for F4/80 (green). (A) unstimulated cells, (B) cells stimulated with IFN gamma and LPS, (C) cells stimulated with IL-4. (D–F) Bone-marrow-derived cells isolated from Mus and stained for F4/80 (green). (D) unstimulated cells, (E) cells stimulated with IFN gamma and LPS, and (F) cells stimulated with IL-4. Scale bar = 50 μm. (G) Acomys ear tissue at D15 after injury stained for F4/80 (green), CD206 (red) and DAPI (grey). (H) Mus ear tissue at D7 after injury stained for F4/80 (green), CD206 (red) and DAPI (grey). Scale bar = 50 μm.DOI:https://dx.doi.org/10.7554/eLife.24623.012 Image collected and cropped by CiteAb from the following publication (https://pubmed.ncbi.nlm.nih.gov/28508748), licensed under a CC-BY license. Not internally tested by R&D Systems.
 View Larger
Detection of Mouse MMR/CD206/Mannose Receptor by Immunocytochemistry/Immunofluorescence Mouse LLECs take up A beta 1-40. a Schematic showing the site of dye and A beta 1-40 perfusion into the CSF via the cisterna magna (arrow) of a 2-month old mouse. The dotted line indicates the plane of section. A anterior, P posterior, D dorsal, V ventral. b Coronal brain section indicating the areas imaged. SF4 refers to area captured in Figure S4. c The percentage of each labelled cell type that internalized perfused A beta. Cells co-expressing VEGFR3 and LYVE1 take up A beta at a higher rate than MRC1, LYVE1 double-positive cells as well as MRC1-positive, LYVE1-negative cells (p ≤ 0.05, bootstrap). VEGFR3, LYVE1 counts, n = 2 brains (3 sections/brain). MRC1, LYVE1 counts, n = 3 brains (3 sections/brain). d–d′′′ Cells of the adult mouse meninges that co-express VEGFR3 (d, green) and LYVE1 (d′, white) internalize A beta 1-40 (d′′, cyan). Scale = 20 µm. e-e′′′) Cells of the adult mouse meninges that co-express VEGFR3 (e, green) and MRC1 (e′, white) internalize A beta 1-40 (e′′, cyan). Scale = 40 µm. f–f′′′) Cells of the adult mouse meninges that co-express MRC1 (f, magenta) and LYVE1 (f′, white) internalize A beta 1-40 (f′′, cyan). The walls of a blood vessel (white arrowhead, f′′) also accumulate A beta 1-40. Scale = 60 µm Image collected and cropped by CiteAb from the following publication (https://pubmed.ncbi.nlm.nih.gov/31696318), licensed under a CC-BY license. Not internally tested by R&D Systems.
 View Larger
Detection of Mouse MMR/CD206/Mannose Receptor by Immunocytochemistry/Immunofluorescence In vitro activation assays shows Acomys macrophages can be polarized to express different markers.(A–I) Bone-marrow-derived macrophages isolated from Acomys femurs are cultured with no cytokines (unstimulated, A, D, G) with IFN gamma +LPS (M1, B, E, H) or with IL-4 (M2, C, F, I). Immunocytochemistry for the pan-macrophage marker CD11b (green) (A–C), for the M1 macrophage marker CD86 (green) and the M2 macrophage marker Arginase 1 (red) (D–F), or CD206 (red) (G–I). (J–R). Bone-marrow-derived macrophages were isolated from Mus femurs and cultured with no cytokines (J, M, P) with IFN gamma and LPS (K, N, Q) or with IL4 (L, O, R) as above. Immunocytochemistry was performed for CD11b (green) (J–K), for CD86 (green) and Arginase 1 (red) (M–O), and CD206 (red) (P–R). Nuclei were counterstained with DAPI (grey) in all panels. Scale bars = 50 μm. Images are representative of n = 3 technical replicates.DOI:https://dx.doi.org/10.7554/eLife.24623.011Immunofluorescent staining for macrophage marker F4/80 in Acomys and Mus.(A–C) Bone-marrow-derived cells isolated from Acomys and stained for F4/80 (green). (A) unstimulated cells, (B) cells stimulated with IFN gamma and LPS, (C) cells stimulated with IL-4. (D–F) Bone-marrow-derived cells isolated from Mus and stained for F4/80 (green). (D) unstimulated cells, (E) cells stimulated with IFN gamma and LPS, and (F) cells stimulated with IL-4. Scale bar = 50 μm. (G) Acomys ear tissue at D15 after injury stained for F4/80 (green), CD206 (red) and DAPI (grey). (H) Mus ear tissue at D7 after injury stained for F4/80 (green), CD206 (red) and DAPI (grey). Scale bar = 50 μm.DOI:https://dx.doi.org/10.7554/eLife.24623.012 Image collected and cropped by CiteAb from the following publication (https://pubmed.ncbi.nlm.nih.gov/28508748), licensed under a CC-BY license. Not internally tested by R&D Systems.
 View Larger
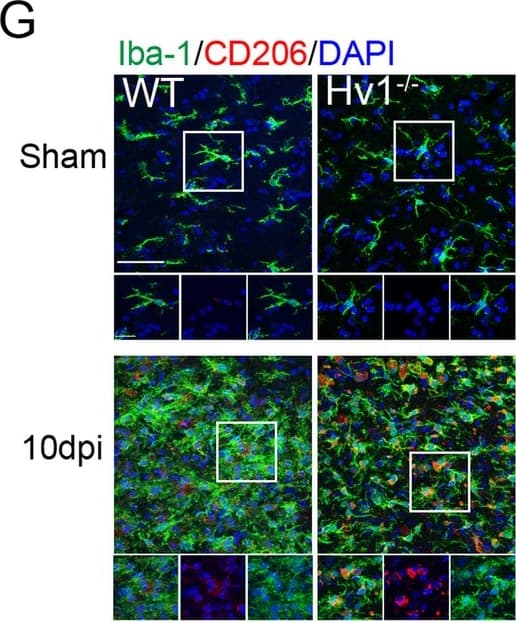
Detection of Mouse MMR/CD206/Mannose Receptor by Immunohistochemistry Microglial activation was attenuated by Hv1 deletion following LPC-induced demyelination. a Representative images of Iba-1 immunostaining in the CC of WT and Hv1−/− mice (scale bar, 200 μm). b Quantification of the number of microglia per high-power field (HPF) in the CC. Each point of WT and Hv1−/− mice, N = 5-7 mice. c Representative images of Iba-1 morphology and the corresponding 3D reconstructions (scale bars, magnified images, 20 μm; 3D reconstruction images, 5um) d Quantification analysis of the soma of microglia. Each point of WT and Hv1−/− mice, N = 4-6 mice, 6-15 cells per mouse. e Representative images of Iba-1 and CD16/32 co-localization in the CC of WT and Hv1−/− mice (scale bar, 50 μm; magnified images, 20 μm). f Quantification of the ratio of CD16/32+/Iba-1+. Each point of WT mice, N = 5-8 mice; Hv1−/− mice, N = 5-8 mice. g Representative images of Iba-1 and CD206 co-localization in the CC of WT and Hv1−/− mice (scale bar, 50 μm; magnified images, 20 μm). h Quantification of the ratio of CD206+/Iba-1+. Each point of WT mice, N = 6-7 mice; Hv1−/− mice, N = 5-6 mice. Data are shown as mean ± SD, *P < 0.05, ***P<0.001, two-way ANOVA with Dunnett’s post hoc test Image collected and cropped by CiteAb from the following publication (https://pubmed.ncbi.nlm.nih.gov/33158440), licensed under a CC-BY license. Not internally tested by R&D Systems.
 View Larger
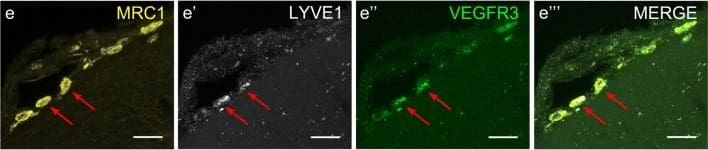
Detection of Mouse MMR/CD206/Mannose Receptor by Immunocytochemistry/Immunofluorescence Cells with BLEC molecular markers are present within the mouse leptomeninges. a Coronal brain section of adult zebrafish brain indicating the imaging area in the dorsal optic tectum (TeO). b A 14 month old Tg(kdr-l:mCherry); Tg(flt4:mCitrine) double transgenic zebrafish has cells in the meninges (white bracket) that express flt4/vegfr3 ( alpha -GFP, green) near kdr-l positive ( alpha -RFP, red) blood vessels. DAPI (blue) labels the nuclei. Scale = 50 µm. c Coronal mouse brain section showing the imaging areas of the meninges. d As revealed by IHC, 17-week-old mouse brains express VEGFR3 (green) in the meninges (white bracket). Tie2-GFP;NG2-DsRed double reporter mice were used to distinguish arteries and veins. NG2 (red) labels pericytes and smooth muscle cells, Tie2 (magenta) labels vascular endothelial cells, and Hoechst (blue) stains nuclei. The image is rotated with the parenchyma at the bottom for ease of comparison with panel b. Scale = 50 µm. e-e′′′ As revealed by IHC, cells of the meninges co-express MRC1 (e, yellow), LYVE1 (e′, white), and VEGFR3 (e′′, green). Red arrows highlight cells expressing these three markers. The images are rotated with the parenchyma at the bottom. scale = 30 µm. f, g Quantification of the relative numbers of single and double-labelled cells in 2-month old mouse meninges. VEGFR3 and LYVE1 cell counts were from n = 2 brains, 3 coronal sections (10 area images)/brain. MRC1 and LYVE1 cell counts were from n = 3 brains, 3 coronal sections (4 area images)/brain. The mean values for each set are depicted Image collected and cropped by CiteAb from the following publication (https://pubmed.ncbi.nlm.nih.gov/31696318), licensed under a CC-BY license. Not internally tested by R&D Systems.
 View Larger
Detection of Mouse MMR/CD206/Mannose Receptor by Immunocytochemistry/Immunofluorescence M1 and M2 phenotype in spinal cord after intraplantar IL-1 beta. Wild-type (WT) and LysM-G protein–coupled receptor kinase (GRK)2+/− mice received an intraplantar injection of 1 ng IL-1 beta. At 15 hours after injection, spinal cord was collected, and frozen sections of (A) lumbar spinal cord (L2 to L5) and as control (B) thoracic spinal cord (T6 to T10) were stained for M1 (CD16/32) and M2 (CD206 and arginase-I) phenotypic markers. A representative example of M1 and M2 staining in the dorsal horn of one of the four mice per group is displayed. Scale bar indicates 20 μm. (C) Quantification of microglia/macrophages expressing M1 and M2 phenotypic markers in spinal cord from WT and LysM-GRK2+/− mice. Expression was quantified in approximately 10 to 15 dorsal horns of spinal cords per group (4 mice per group). The level of expression in the lumbar or thoracic area from control WT mice was set at 100%. Data are expressed as means ± SEM. **P < 0.01, ***P < 0.001. Image collected and cropped by CiteAb from the following publication (https://pubmed.ncbi.nlm.nih.gov/22731384), licensed under a CC-BY license. Not internally tested by R&D Systems.
 View Larger
Detection of Human MMR/CD206/Mannose Receptor by Immunocytochemistry/Immunofluorescence Cells of human meninges co-express LLEC markers. a–c DAB-IHC with single antibodies detects VEGFR3 (a), LYVE1 (b), and MRC1 (c) in the meninges of human post mortem brain showing no signs of neuropathology. These images are taken from a 38 year old male (sample P17/07, Table 1), and confirmed in n = 2 additional samples. P parenchyma. Scale = 150 µm (a); 40 µm (b); and 20 µm (c). d–f DAB-IHC with single antibodies detects VEGFR3 (b), LYVE1 (c), and MRC1 (d) in elderly human meninges (age: 89–92) with evidence of neuropathology and confirmed in n = 3 brains (Table 1). P, parenchyma. Scale = 20 µm. g–p IHC with fluorescent antibodies detects human meningeal cells that co-express MRC1 (h, m, yellow), LYVE1 (i, n, white), and VEGFR3 (j, o, green). Nuclei/RNA are labelled with DAPI (g, l, blue) and images are merged in (k, p). Scale = 10 µm Image collected and cropped by CiteAb from the following publication (https://pubmed.ncbi.nlm.nih.gov/31696318), licensed under a CC-BY license. Not internally tested by R&D Systems.
 View Larger
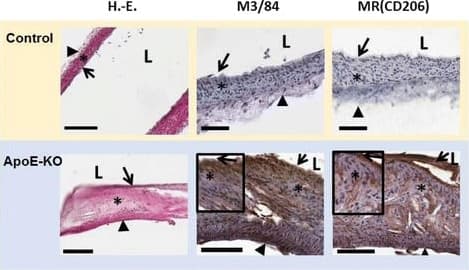
Detection of Mouse MMR/CD206/Mannose Receptor by Immunohistochemistry Representative images of HE, M3/84 (macrophages) and MR (CD206) immunohistochemistry. In control mice, no plaques with macrophages were observed, while fibrous/fibroatheromatous plaques were present in the aortas extracted from ApoE-KO mice. The lesions (fatty streaks and fibrous plaques) showed high amounts of MR+ macrophages (100 μm (bars), vascular lumen (L), intima (arrow), media (asterisk), adventitia (arrowhead)) Image collected and cropped by CiteAb from the following publication (https://pubmed.ncbi.nlm.nih.gov/28470406), licensed under a CC-BY license. Not internally tested by R&D Systems.
Mouse MMR/CD206 Antibody Summary
Leu19-Ala1388
Accession # Q2HZ94
Applications
Please Note: Optimal dilutions should be determined by each laboratory for each application. General Protocols are available in the Technical Information section on our website.
Flow Cytometry(0.25 µg/106 cells)
Immunohistochemistry(5-15 µg/mL)
Background: MMR/CD206
The mouse Macrophage Mannose Receptor (MMR), also known as CD206 and MRC1 (mannose receptor C, type 1), is a 175 kDa scavenger receptor that is expressed on tissue macrophages, myeloid dendritic cells, and liver and lymphatic endothelial cells (1). It belongs to a family of receptors sharing similar protein structure that also includes DEC205, phospholipase A2 receptor, and Endo180 (2, 3). The mouse MMR protein is synthesized as a 1456 amino acid (aa) precursor that contains a 19 aa signal sequence, a 1369 aa extracellular region, a 21 aa transmembrane segment and a 47 aa cytoplasmic domain (4). Its extracellular region is composed of an N-terminal cysteine-rich domain, followed by a single fibronectin type II repeat, and eight C-type lectin carbohydrate recognition domains (CRD) (3‑5). Mouse to human, the extracellular region is 82% aa identical. The cysteine-rich domain mediates recognition of sulfated N-acetylgalactosamine, which occurs on some extracellular matrix proteins and is the terminal sugar of the unusual oligosaccharides present on pituitary hormones such as lutropin and thyrotropin (6). Several of the CRDs participate in the Ca2+-dependent recognition of carbohydrates showing a preference for branched sugars with terminal mannose, fucose or N‑acetylglucosamine (7). The cytoplasmic domain of MMR includes a tyrosine-based motif for internalization in clathrin-coated vesicles. Once internalized, ligands are released following acidification of phagosomes or endosomes, and the receptor recycles to the cell surface (3, 8). MMR mediates phagocytosis upon binding to target structures that occur on a variety of pathogenic microorganisms including Gram-negative and Gram-positive bacteria, yeasts, parasites, and mycobacteria. MMR also functions to maintain homeostasis through the endocytosis of potentially harmful glycoproteins associated with inflammation (2, 3).
- East, L. and C. Isake (2002) Biochim. Biophys. Acta 1572:364.
- Chieppa, M. et al. (2003) J. Immunol. 171:4552.
- Figdor, C. et al. (2002) Nat. Rev. Immunol. 2:77.
- Harris, N. et al. (1992) Blood 80:2363.
- Taylor, M. et al. (1990) J. Biol. Chem. 265:12156.
- Leteux, C. et al. (2000) J. Exp. Med. 191:1117.
- Martinez-Pomares, L. et al. (2001) Immunobiology 204:527.
- Feinberg, H. et al. (2000) J. Biol. Chem. 275:21539.
Preparation and Storage
- 12 months from date of receipt, -20 to -70 °C as supplied.
- 1 month, 2 to 8 °C under sterile conditions after reconstitution.
- 6 months, -20 to -70 °C under sterile conditions after reconstitution.
参考图片
Detection of Mouse MMR/CD206 by Western Blot. Western blot shows lysates of mouse liver tissue. Gels were loaded with 12 µg, 6.5 µg, and 3 µg of tissue lysate. PVDF membrane was probed with 1 µg/mL of Goat Anti-Mouse MMR/CD206 Antigen Affinity-purified Polyclonal Antibody (Catalog # AF2535) followed by HRP-conjugated Anti-Goat IgG Secondary Antibody (Catalog # HAF019). A specific band was detected for MMR/CD206 at approximately 180 kDa (as indicated). This experiment was conducted under reducing conditions and using Immunoblot Buffer Group 1.
MMR/CD206 in Mouse Testis. MMR/CD206 was detected in perfusion fixed frozen sections of mouse testis using Goat Anti-Mouse MMR/CD206 Antigen Affinity-purified Polyclonal Antibody (Catalog # AF2535) at 5 µg/mL overnight at 4 °C. Tissue was stained using the Anti-Goat HRP-DAB Cell & Tissue Staining Kit (brown; Catalog # CTS008) and counterstained with hematoxylin (blue). Specific staining was localized to spermatocytes in testis. View our protocol for Chromogenic IHC Staining of Frozen Tissue Sections.
MMR/CD206 in Mouse Lung. MMR/CD206 was detected in perfusion fixed frozen sections of mouse lung using Goat Anti-Mouse MMR/CD206 Antigen Affinity-purified Polyclonal Antibody (Catalog # AF2535) at 25 µg/mL overnight at 4 °C. Tissue was stained using the NorthernLights™ 493-conjugated Anti-Goat IgG Secondary Antibody (green; Catalog # NL003) and counterstained with DAPI (blue). Specific staining was localized to cytoplasm of macrophages. View our protocol for Fluorescent IHC Staining of Frozen Tissue Sections.