


 全部商品分类
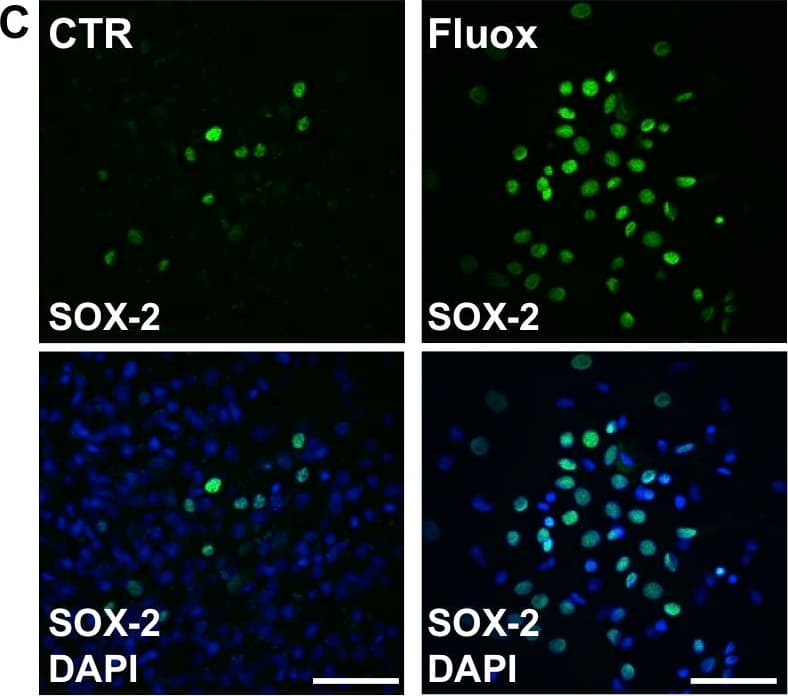


h/m/rSOX2 MAb (Cl 24 (100 ug)


 下载产品说明书 下载SDS
 用小程序,查商品更便捷


 收藏
收藏
 对比
对比 咨询
咨询Simple Western(4 µg/mL)
Immunocytochemistry(8-25 µg/mL)
Intracellular Staining by Flow Cytometry(2.5 µg/106 cells)

Scientific Data
.") View Larger
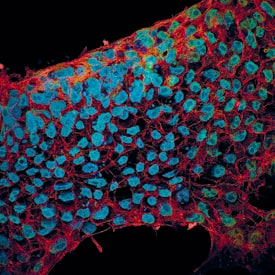
View LargerE‑Cadherin and SOX2 in BG01V Human Stem Cells. E-Cadherin and SOX2 were detected in BG01V human embryonic stem cells using 10 µg/mL Goat Anti-Human E-Cadherin Antigen Affinity-purified Polyclonal Antibody (AF648) and 10 µg/mL Mouse Anti-Human/Mouse/Rat SOX2 Monoclonal Antibody (Catalog # MAB2018). Cells were incubated with primary antibodies for 3 hours at room temperature. Cells were stained for E-Cadherin using the NorthernLights™ 557-conjugated Anti-Goat IgG Secondary Antibody (red; NL001) and for SOX2 using the NorthernLights 493-conjugated Anti-Mouse Secondary Antibody (green; NL009). Cells were counterstained with DAPI (blue). View our protocol for Fluorescent ICC Staining of Cells on Coverslips.
 View Larger
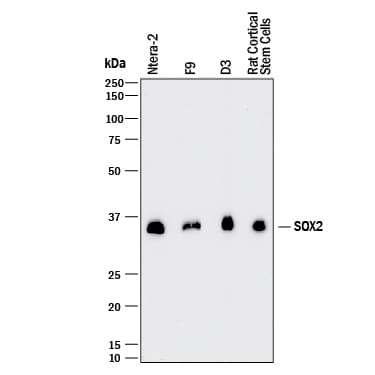
Detection of Human, Mouse, and Rat SOX2 by Western Blot. Western blot shows lysates of NTera-2 human testicular embryonic carcinoma cell line, F9 mouse teratocarcinoma stem cells, D3 mouse embryonic stem cell line, and rat cortical stem cells. PVDF membrane was probed with 1 µg/mL of Mouse Anti-Human/Mouse/Rat SOX2 Monoclonal Antibody (Catalog # MAB2018) followed by HRP-conjugated Anti-Mouse IgG Secondary Antibody (HAF018). A specific band was detected for SOX2 at approximately 36 kDa (as indicated). This experiment was conducted under reducing conditions and using Immunoblot Buffer Group 1.
.") View Larger
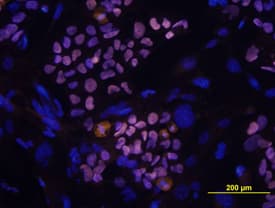
View LargerSOX2 in BG01V Human Embryonic Stem Cells. SOX2 was detected in immersion fixed BG01V human embryonic stem cells using Mouse Anti-Human/ Mouse/Rat SOX2 Monoclonal Antibody (Catalog # MAB2018) at 10 µg/mL for 3 hours at room temperature. Cells were stained using the NorthernLights™ 557-conjugated Anti-Mouse IgG Secondary Antibody (yellow; NL007) and counterstained with DAPI (blue). View our protocol for Fluorescent ICC Staining of Cells on Coverslips.
 View Larger
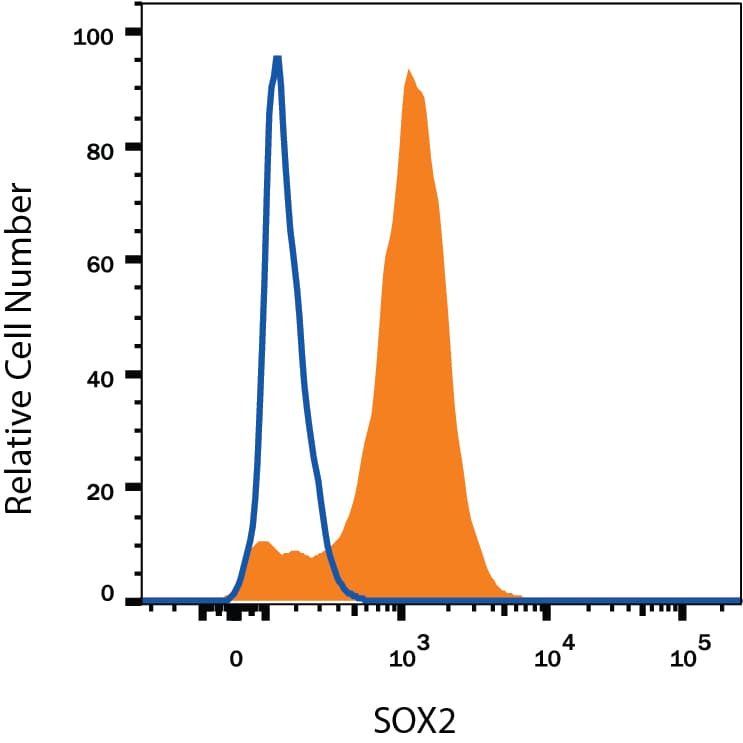
Detection of SOX2 in NTera‑2 Human Cell Line by Flow Cytometry. NTera-2 human testicular embryonic carcinoma cell line was stained with Mouse Anti-Human/ Mouse/Rat SOX2 Monoclonal Antibody (Catalog # MAB2018, filled histogram) or isotype control antibody (MAB003, open histogram), followed by Phycoerythrin-conjugated Anti-Mouse IgG Secondary Antibody (F0102B). To facilitate intracellular staining, cells were fixed with Flow Cytometry Fixation Buffer (FC004) and permeabilized with Flow Cytometry Permeabilization/Wash Buffer I (FC005). View our protocol for Staining Intracellular Molecules.
 View Larger
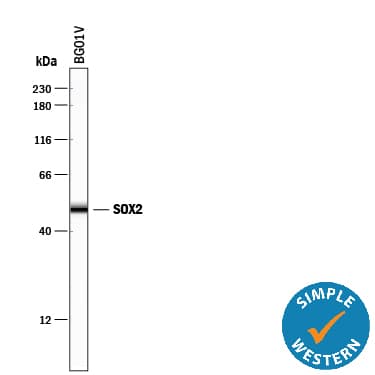
Detection of Human SOX2 by Simple WesternTM. Simple Western lane view shows lysates of BG01V human embryonic stem cells, loaded at 0.2 mg/mL. A specific band was detected for SOX2 at approximately 50 kDa (as indicated) using 4 µg/mL of Mouse Anti-Human/Mouse/Rat SOX2 Monoclonal Antibody (Catalog # MAB2018). This experiment was conducted under reducing conditions and using the 12-230 kDa separation system.
 View Larger
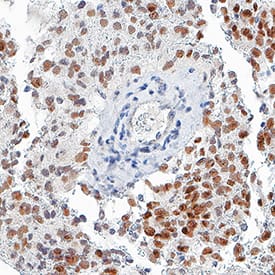
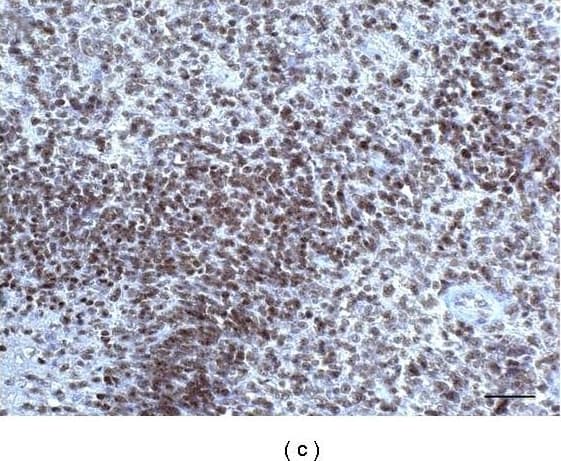
Detection of SOX2 in glioblastoma. SOX2 was detected in immersion fixed paraffin-embedded sections of glioblastoma using Mouse Anti-Human/Mouse/Rat SOX2 Monoclonal Antibody (Catalog # MAB2018) at 3 µg/mL for 1 hour at room temperature followed by incubation with the Anti-Mouse IgG VisUCyte™ HRP Polymer Antibody (Catalog # VC001). Before incubation with the primary antibody, tissue was subjected to heat-induced epitope retrieval using VisUCyte Antigen Retrieval Reagent-Basic (Catalog # VCTS021). Tissue was stained using DAB (brown) and counterstained with hematoxylin (blue). Specific staining was localized to nuclei in cancer cells. View our protocol for IHC Staining with VisUCyte HRP Polymer Detection Reagents.
 View Larger
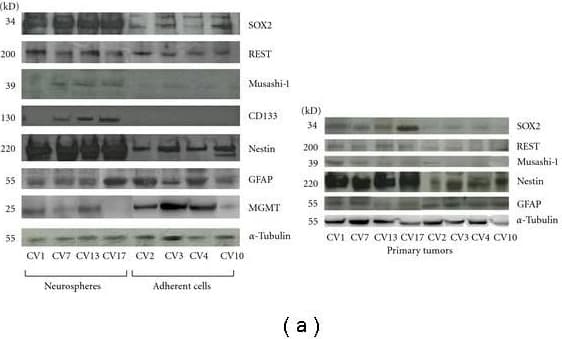
Detection of Human SOX2 by Western Blot Western blotting analysis of the different antigens studied in cell lines (NS and AC) and in primary tumors. (a) Stemness antigens and differentiation antigens prevail in NS and AC, respectively. (b) Densitometric quantification of bands in NS and in the corresponding primary tumors. (c) Densitometric quantification of bands in AC and in the corresponding primary tumors. Image collected and cropped by CiteAb from the following publication (https://pubmed.ncbi.nlm.nih.gov/21869887), licensed under a CC-BY license. Not internally tested by R&D Systems.
 View Larger
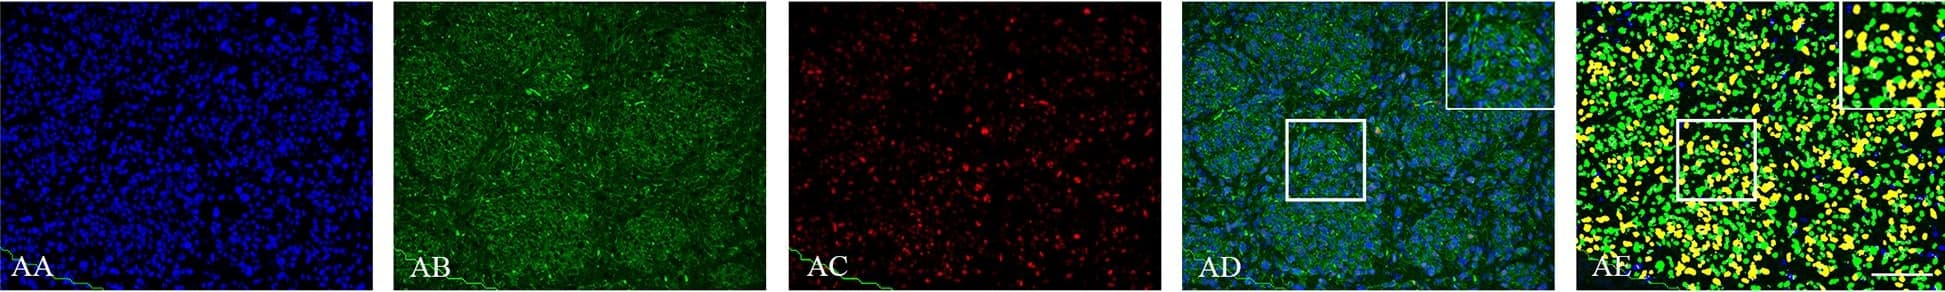
Detection of Human SOX2 by Immunocytochemistry/Immunofluorescence Double immunofluorescence staining of core and periphery in orthotopic model with five different patient derived GBM spheroid cultures.Tissues were stained with Dapi (blue), Vimentin (green) and Sox-2 (red), Bmi-1 (red) and Glut-3 (red). The software-based classifier is shown in the right column. The classifier illustrates tumor cells co-expressing markers of interest in yellow and tumor cells not co-expressing markers of interest in green. The fluorescence stainings were quantified in both central part and periphery for Sox-2 (G), Bmi-1 (H) and Glut-3 (I). Statistical comparison was performed using student’s t-test. Scalebar: 200μm. Image collected and cropped by CiteAb from the following publication (https://dx.plos.org/10.1371/journal.pone.0155106), licensed under a CC-BY license. Not internally tested by R&D Systems.
 View Larger
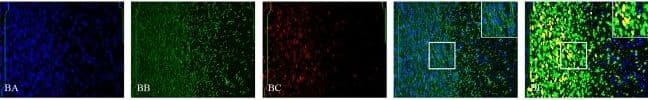
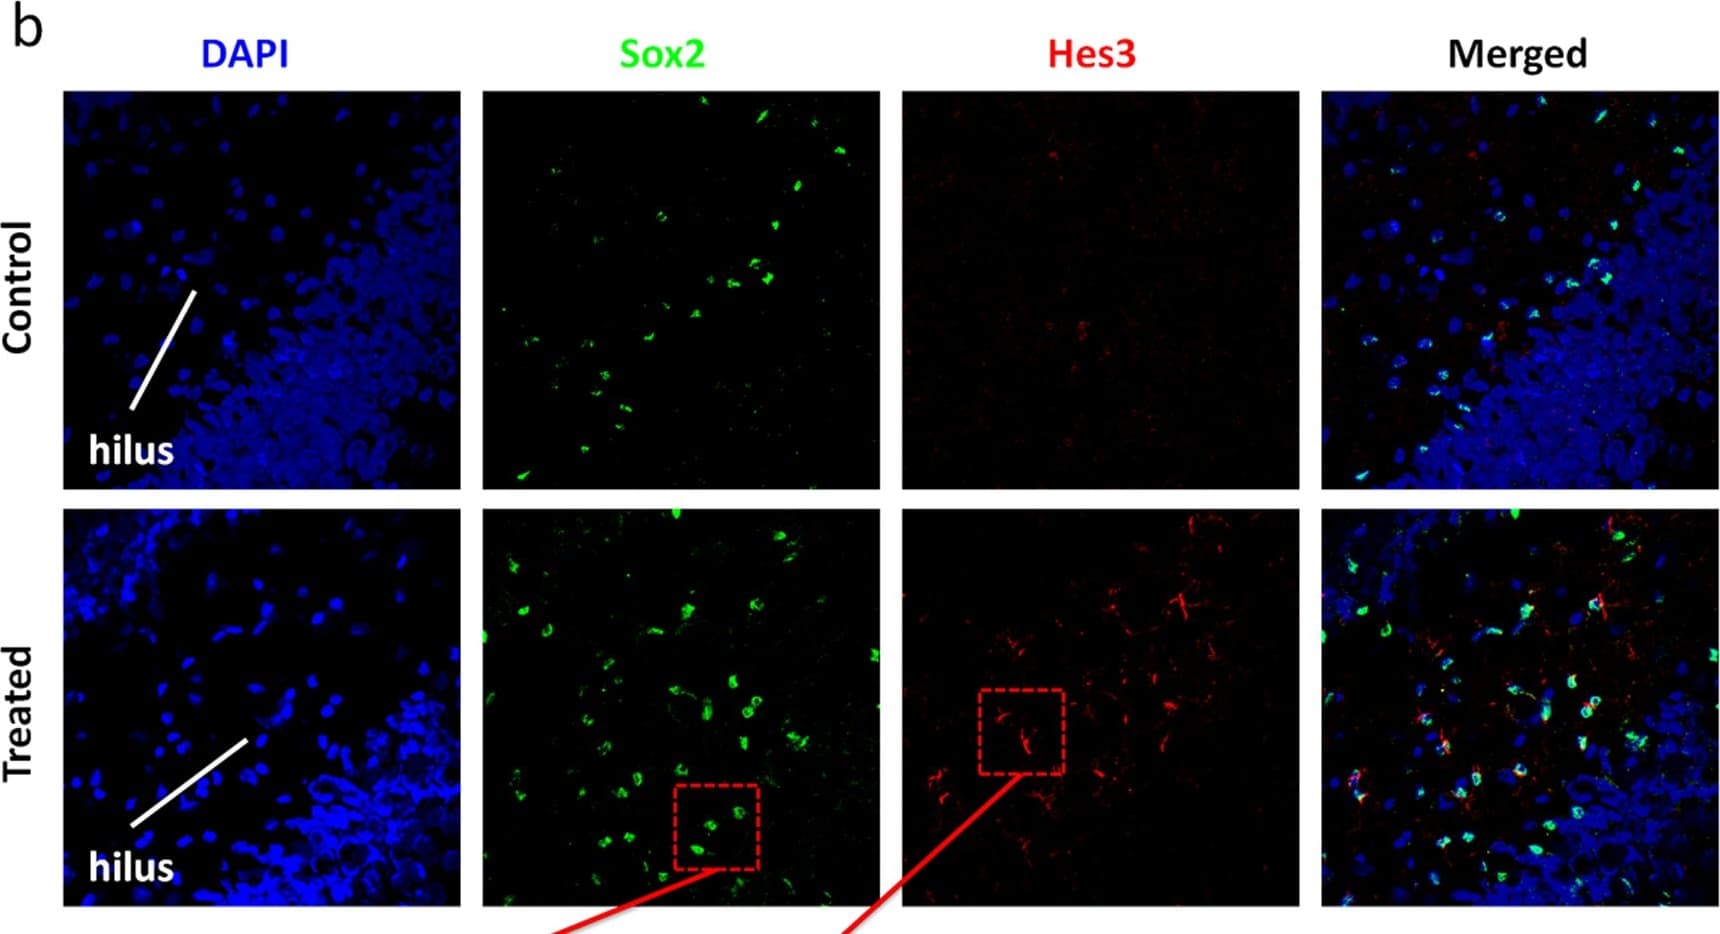
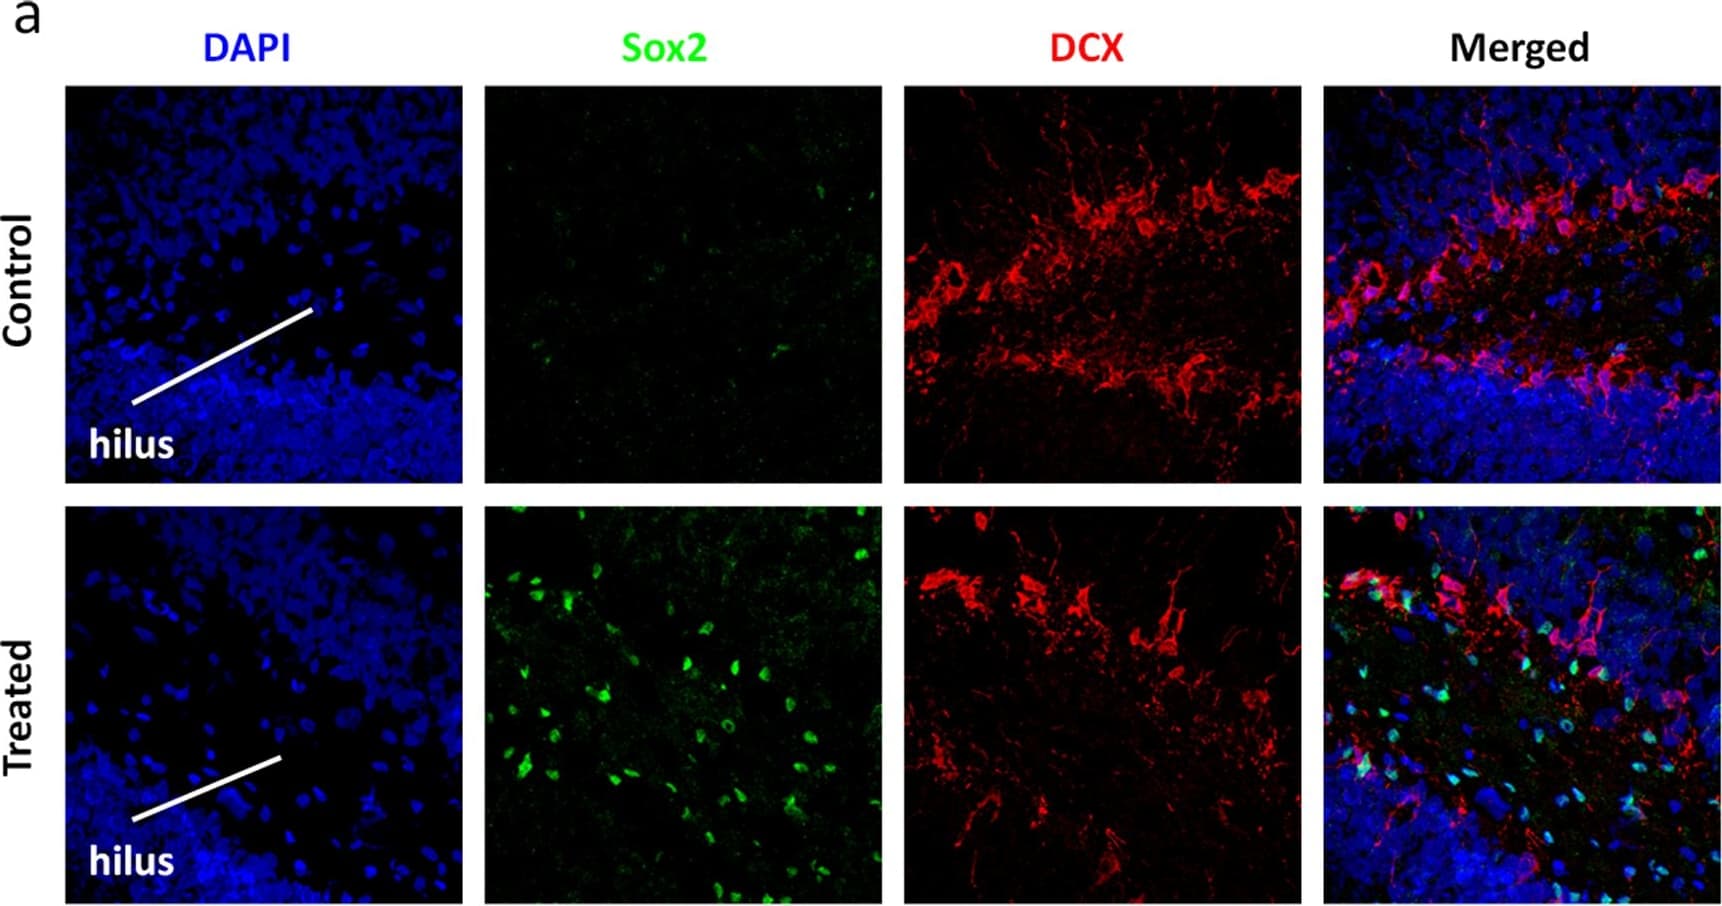
Detection of Rat SOX2 by Immunocytochemistry/Immunofluorescence Soluble factors increase the numbers of Hes3+ cells in the adult rat hippocampus.(a) Treatment with the soluble factors induced a powerful increase in the number of Sox2+ cells in the hilus [Quantifications are from images taken from the tip of the hilus to approximately 1,300 micrometers towards the CA3 region – representative images are shown. Staining for the young neuron marker doublecortin (DCX) helps to visualize the subgranular zone]. (b) The same treatment also induced an increase in the numbers of Hes3+ cells in the hilus. (c) Sox2+ cells inside the hilus co-expressed Hes3; in contrast, Sox2+ cells in the subgranular zone did not co-express Hes3. (d,e) Quantification graphs of the increases in Sox2+ and Hes3+ cell numbers in the hilus (p<0.05). For the graph, the number of cells in the sham operated control animals was set to 100%. [Width of images: a, 650 micrometers; b, 650 micrometers]. Image collected and cropped by CiteAb from the following publication (https://dx.plos.org/10.1371/journal.pone.0051630), licensed under a CC-BY license. Not internally tested by R&D Systems.
 View Larger
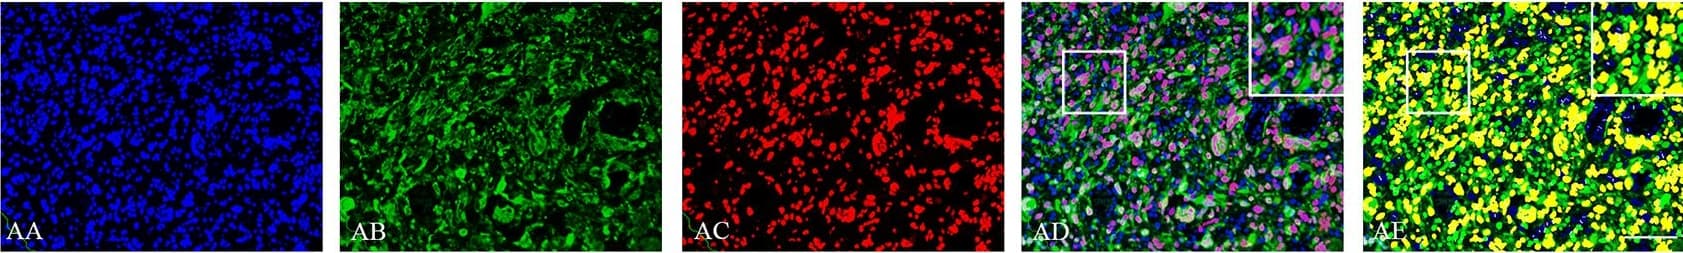
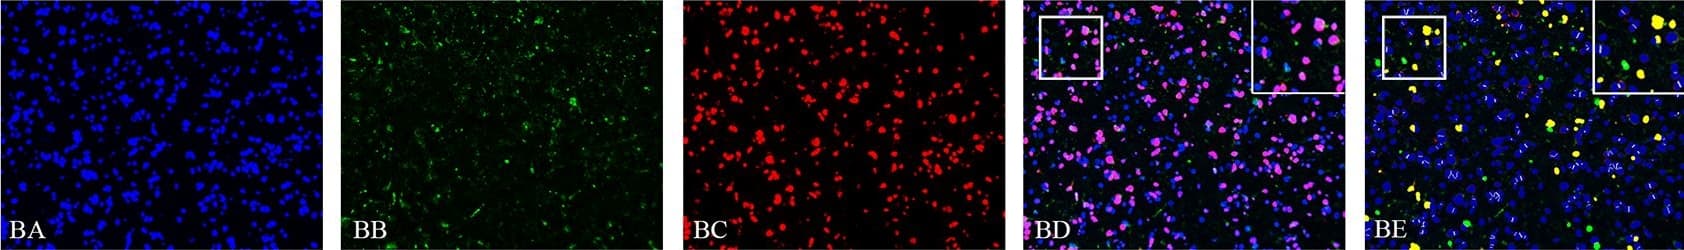
Detection of Human SOX2 by Immunocytochemistry/Immunofluorescence Double immunofluorescence staining of core and periphery of patient glioblastomas.Histological sections were stained with Dapi (blue), IDH1 (green) and Sox-2 (red) (AA-BE), Bmi-1 (red) (CA-DE) and Glut-3 (red) (EA to FE). The software-based classifier is shown in the right column. The classifier illustrates tumor cells co-expressing markers of interest in yellow and tumor cells not co-expressing markers of interest in green. The fluorescence stainings were quantified in both core and periphery for Sox-2 (G,J), Bmi-1 (H,K) and Glut-3 (I,L). Statistical comparison was performed using student’s t-test and ANOVA, ** p< 0.01. Scalebar: 200μm. Image collected and cropped by CiteAb from the following publication (https://dx.plos.org/10.1371/journal.pone.0155106), licensed under a CC-BY license. Not internally tested by R&D Systems.
 View Larger
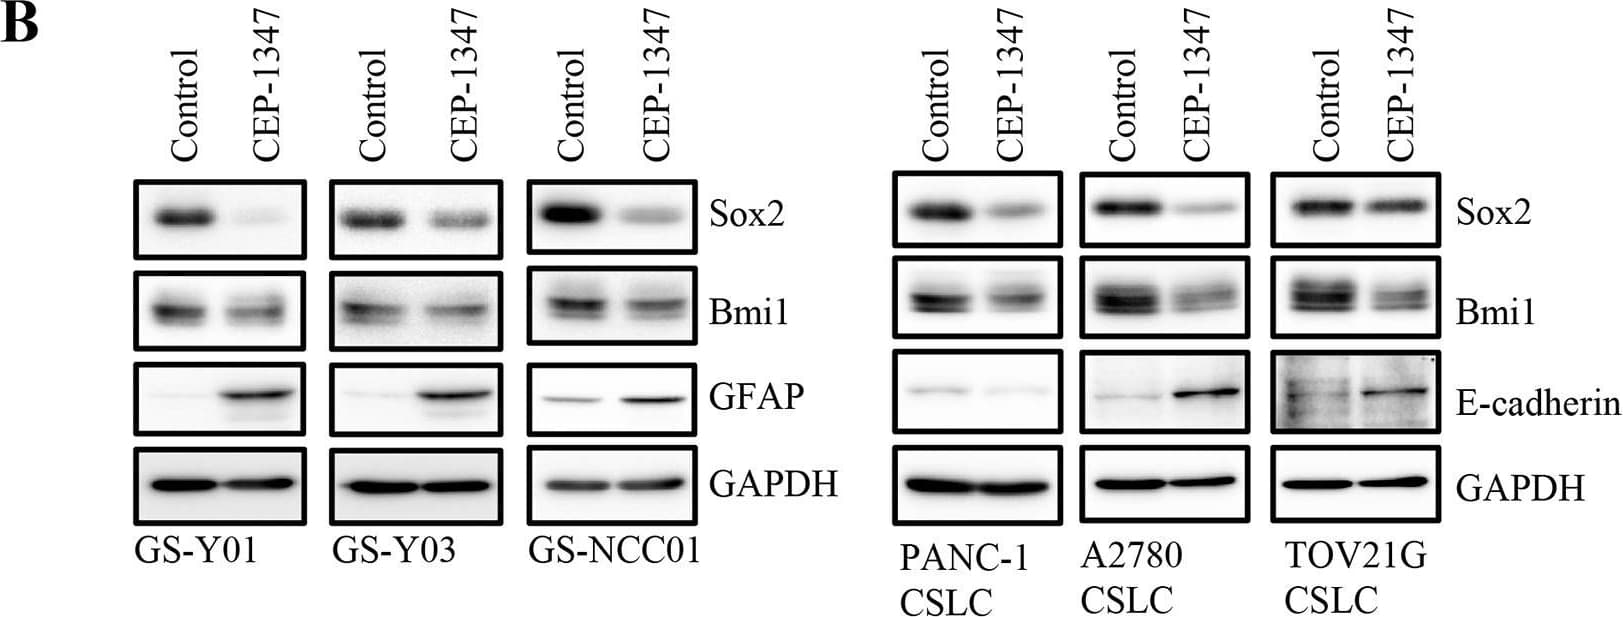
Detection of Human SOX2 by Western Blot CEP-1347 induces the differentiation of cancer stem cells into non-cancer stem cells(A) Glioma stem cells (GS-Y01, GS-Y03, and GS-NCC01), pancreatic cancer stem cells (PANC-1 CSLC), and ovarian cancer stem cells (A2780 CSLC, and TOV21G CSLC) treated without (Control) or with CEP-1347 (300 nM for PANC-1 CSLC, 200 nM for the others) for 6 days were subjected to flow cytometric analysis of the cell-surface expression of CD133. Representative flow cytometric plots together with the percentages of CD133-positive cells are shown. (B) Cells treated as described in (A) were subjected to immunoblot analysis of the indicated proteins. (C) PANC-1 CSLC cells treated without (Control: lane 1) or with CEP-1347 (lane 2) for 6 days and those cultured in the presence of CEP-1347 for 6 days and then in its absence for the indicated days (lanes 3-5) were subjected to immunoblot analysis of the indicated proteins. Image collected and cropped by CiteAb from the following publication (https://www.oncotarget.com/lookup/doi/10.18632/oncotarget.22033), licensed under a CC-BY license. Not internally tested by R&D Systems.
 View Larger
Detection of Rat SOX2 by Immunocytochemistry/Immunofluorescence Fluoxetine inhibits the differentiation of hypothalamic neuroprogenitor cells.Hypothalamic neuroprogenitor cells were differentiated for 18 days, in the presence or absence of fluoxetine (1 µM). Representative confocal photomicrographs for mature neurons marker Neu-N (green) (A). Fluoxetine decreases the percentage of Neu-N positive cells and the incubation with Trk receptors inhibitor K252a (24 h) partially reverses this effect (B). Representative confocal photomicrographs for the progenitor cells marker SOX-2 (green) (C). Fluoxetine increases the percentage of SOX-2 positive cells and the incubation with K252a (24 h) does not change this effect (D). Fluoxetine does not up regulate the levels of neurotrophic factor BDNF but incubation with K252a (24 h) results in a compensatory increase of BDNF mRNA levels (E). DAPI (blue), nuclear staining. Mean ± SEM; n = 4/5; One-Way ANOVA; ns, p>0.05; *, p<0.05; ***, p<0.001 compared to control; NS, p>0.05, #, p<0.05 compared to fluoxetine. Scale bar: 50 µm. Image collected and cropped by CiteAb from the following publication (https://pubmed.ncbi.nlm.nih.gov/24598761), licensed under a CC-BY license. Not internally tested by R&D Systems.
 View Larger
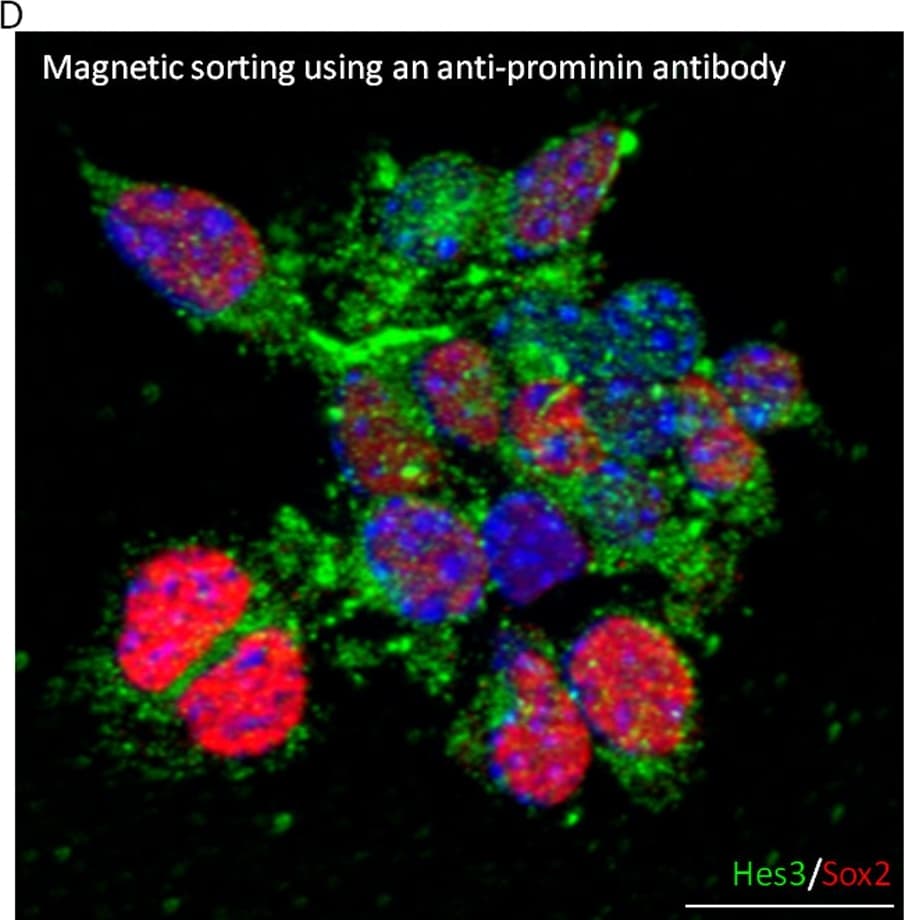
Detection of Human SOX2 by Immunocytochemistry/Immunofluorescence Hes3 is a marker of normal and cancer human stem cells.(A–C) Hes3+ cell in the striatum of non-cancerous adult human brain tissue (blood vessels identified by RECA-1 expression), human hemangioblastoma (HBM) biopsy (HBM Hes3+ megakaryocytes shown), human glioblastoma multiforme (GBM) biopsy (Hes3 co-expressed with prominin). (D) Fetal cortical cells sorted for prominin express Sox2 and Hes3. (E) Enrichment for Sox2+ and Hes3+ cells by magnetic sorting using an anti-prominin antibody. (Size bar, 50 µm). Image collected and cropped by CiteAb from the following publication (https://pubmed.ncbi.nlm.nih.gov/20195471), licensed under a CC-BY license. Not internally tested by R&D Systems.
 View Larger
Detection of Human SOX2 by Immunocytochemistry/Immunofluorescence Double immunofluorescence staining of core and periphery of patient glioblastomas.Histological sections were stained with Dapi (blue), IDH1 (green) and Sox-2 (red) (AA-BE), Bmi-1 (red) (CA-DE) and Glut-3 (red) (EA to FE). The software-based classifier is shown in the right column. The classifier illustrates tumor cells co-expressing markers of interest in yellow and tumor cells not co-expressing markers of interest in green. The fluorescence stainings were quantified in both core and periphery for Sox-2 (G,J), Bmi-1 (H,K) and Glut-3 (I,L). Statistical comparison was performed using student’s t-test and ANOVA, ** p< 0.01. Scalebar: 200μm. Image collected and cropped by CiteAb from the following publication (https://dx.plos.org/10.1371/journal.pone.0155106), licensed under a CC-BY license. Not internally tested by R&D Systems.
 View Larger
Detection of Human SOX2 by Immunocytochemistry/Immunofluorescence Immunohistochemistry of a parallel section of Figure 1. (a) Poor GFAP expression. (b) High Nestin expression. (c) SOX2 is highly expressed in nuclei of the external slope of circumscribed necrosis. (d) REST expression, all DAB. (e) CD133-positive area, frozen section. (f) Musashi-1-positive area. Scale bar 50 μm. Image collected and cropped by CiteAb from the following publication (https://pubmed.ncbi.nlm.nih.gov/21869887), licensed under a CC-BY license. Not internally tested by R&D Systems.
 View Larger
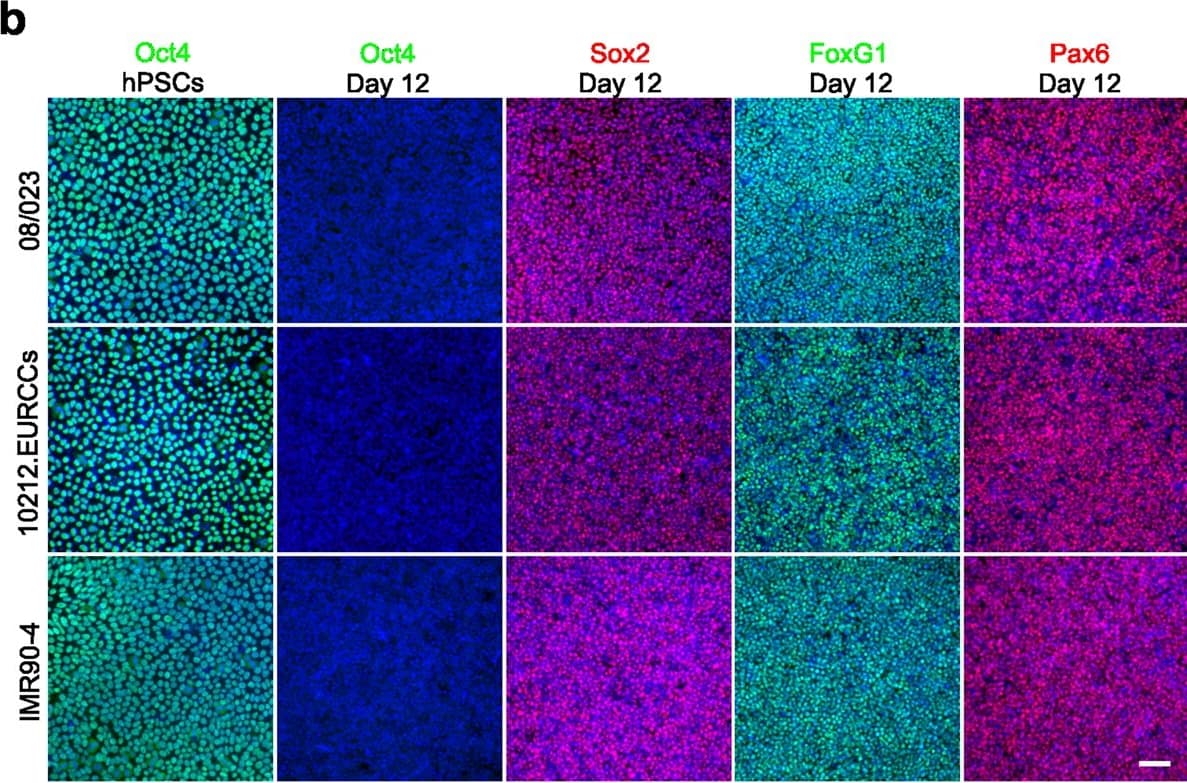
Detection of Human SOX2 by Immunocytochemistry/Immunofluorescence Neural induction of hPSCs. (a) Both hPSC culture and neural differentiation were performed on LN521 substrate. Cortical neurons were induced with dual SMAD inhibition, expanded in the presence of FGF2, and matured with support by a selection of neurotrophic factors. Neural progenitor cells (NPCs) could be cryopreserved at day 21 and plated at day 32 for final experiments, including microelectrode array (MEA) measurements. (b) Three different hPSC lines (one hESC line, 08/023 and two hiPSC lines, 10212.EURCCs and IMR90-4) were characterized for their efficiency in producing neuroectodermal cells in response to 12-day neural induction by dual SMAD inhibition. Cells were stained for pluripotency marker Oct4 at the pluripotent stage and after 12 days of neural induction. The presence of early neuroectodermal markers was evaluated with Sox2, FoxG1 and Pax6 staining. (c) After 21 days of differentiation, the culture contained vimentin- and Pax6-positive NPCs that could be cryopreserved. Additionally, the first Tbr2- and MAP2-positive neurons were detected at this time point. (d) The percentages of Pax6-positive cells were quantified at four time points of differentiation (mean ± s.e.m., n = 5–14, data derived from 1–3 independent differentiations). Statistical analysis was performed with the Mann-Whitney U test to compare differences between day 12 and day 46 within each hPSC line, and significant p-values are presented in the image. The scale bar is 50 µm in all images. Image collected and cropped by CiteAb from the following publication (https://pubmed.ncbi.nlm.nih.gov/31748598), licensed under a CC-BY license. Not internally tested by R&D Systems.
 View Larger
Detection of Human SOX2 by Immunocytochemistry/Immunofluorescence Double immunofluorescence staining of core and periphery in orthotopic model with five different patient derived GBM spheroid cultures.Tissues were stained with Dapi (blue), Vimentin (green) and Sox-2 (red), Bmi-1 (red) and Glut-3 (red). The software-based classifier is shown in the right column. The classifier illustrates tumor cells co-expressing markers of interest in yellow and tumor cells not co-expressing markers of interest in green. The fluorescence stainings were quantified in both central part and periphery for Sox-2 (G), Bmi-1 (H) and Glut-3 (I). Statistical comparison was performed using student’s t-test. Scalebar: 200μm. Image collected and cropped by CiteAb from the following publication (https://dx.plos.org/10.1371/journal.pone.0155106), licensed under a CC-BY license. Not internally tested by R&D Systems.
Human/Mouse/Rat SOX2 Antibody Summary
Gly135-Met317
Accession # P48431
Applications
Please Note: Optimal dilutions should be determined by each laboratory for each application. General Protocols are available in the Technical Information section on our website.
Simple Western(4 µg/mL)
Immunocytochemistry(8-25 µg/mL)
Intracellular Staining by Flow Cytometry(2.5 µg/106 cells)
Background: SOX2
SOX2 belongs to the SOX (SRY-like HMG box) family of transcription factors with diverse roles in development. SOX2 functions in specifying the first three lineages present at implantation and in regulating proliferation and differentiation in the developing peripheral nervous system (1-6).
- Graham, V. et al. (2003) Neuron 39:749.
- Avilion, A.A. et al. (2003) Genes Dev. 17:126.
- Kishi, M. et al. (2000) Development 127:791.
- Yuan, H. et al. (1995) Genes Dev. 9:2635.
- Uwanogho, D. et al. (1995) Mech. Dev. 49:23.
- Stevanovic, M. (2003) Mol. Biol. Rep. 30:127.
Preparation and Storage
- 12 months from date of receipt, -20 to -70 °C as supplied.
- 1 month, 2 to 8 °C under sterile conditions after reconstitution.
- 6 months, -20 to -70 °C under sterile conditions after reconstitution.
参考图片
E‑Cadherin and SOX2 in BG01V Human Stem Cells. E‑Cadherin and SOX2 were detected in BG01V human embryonic stem cells using 10 µg/mL Goat Anti-Human E‑Cadherin Antigen Affinity-purified Polyclonal Antibody (Catalog # AF648) and 10 µg/mL Mouse Anti-Human/Mouse SOX2 Monoclonal Antibody (Catalog # MAB2018). Cells were incubated with primary antibodies for 3 hours at room temperature. Cells were stained for E‑Cadherin using the NorthernLights™ 557-conjugated Anti-Goat IgG Secondary Antibody (green; Catalog # NL001) and for SOX2 using the NorthernLights 493-conjugated Anti-Mouse Secondary Antibody (red; Catalog # NL009). Cells were counterstained with DAPI (blue). View our protocol for Fluorescent ICC Staining of Cells on Coverslips.
Detection of Human SOX2 by Western Blot. Western blot shows lysates of BG01V human embryonic stem cells and NTera‑2 human testicular embryonic carcinoma cell line. PVDF membrane was probed with 0.2 µg/mL of Mouse Anti-Human/Mouse SOX2 Monoclonal Antibody (Catalog # MAB2018) followed by HRP-conjugated Anti-Mouse IgG Secondary Antibody (Catalog # HAF007). This experiment was conducted under reducing conditions and using Immunoblot Buffer Group 1.
SOX2 in BG01V Human Embryonic Stem Cells. SOX2 was detected in immersion fixed BG01V human embryonic stem cells using Mouse Anti-Human/Mouse SOX2 Monoclonal Antibody (Catalog # MAB2018) at 10 µg/mL for 3 hours at room temperature. Cells were stained using the NorthernLights™ 557-conjugated Anti-Mouse IgG Secondary Antibody (yellow; Catalog # NL007) and counterstained with DAPI (blue). View our protocol for Fluorescent ICC Staining of Cells on Coverslips.
Detection of SOX2 in NTera‑2 Human Cell Line by Flow Cytometry. NTera‑2 human testicular embryonic carcinoma cell line was stained with Mouse Anti-Human/Mouse SOX2 Monoclonal Antibody (Catalog # MAB2018, filled histogram) or isotype control antibody (Catalog # MAB003, open histogram), followed by Phycoerythrin-conjugated Anti-Mouse IgG Secondary Antibody (Catalog # F0102B). To facilitate intracellular staining, cells were fixed with Flow Cytometry Fixation Buffer (Catalog # FC004) and permeabilized with Flow Cytometry Permeabilization/Wash Buffer I (Catalog # FC005). View our protocol for Staining Intracellular Molecules.
Detection of Human SOX2 by Simple WesternTM. Simple Western lane view shows lysates of BG01V human embryonic stem cells, loaded at 0.2 mg/mL. A specific band was detected for SOX2 at approximately 50 kDa (as indicated) using 4 µg/mL of Mouse Anti-Human/Mouse SOX2 Monoclonal Antibody (Catalog # MAB2018). This experiment was conducted under reducing conditions and using the
12-230 kDa separation system.