


 全部商品分类


BD Horizon™ BV510 Rat Anti-Mouse TER-119/Erythroid Cells


 下载产品说明书
 用小程序,查商品更便捷


 收藏
收藏
 对比
对比 咨询
咨询
参考图片
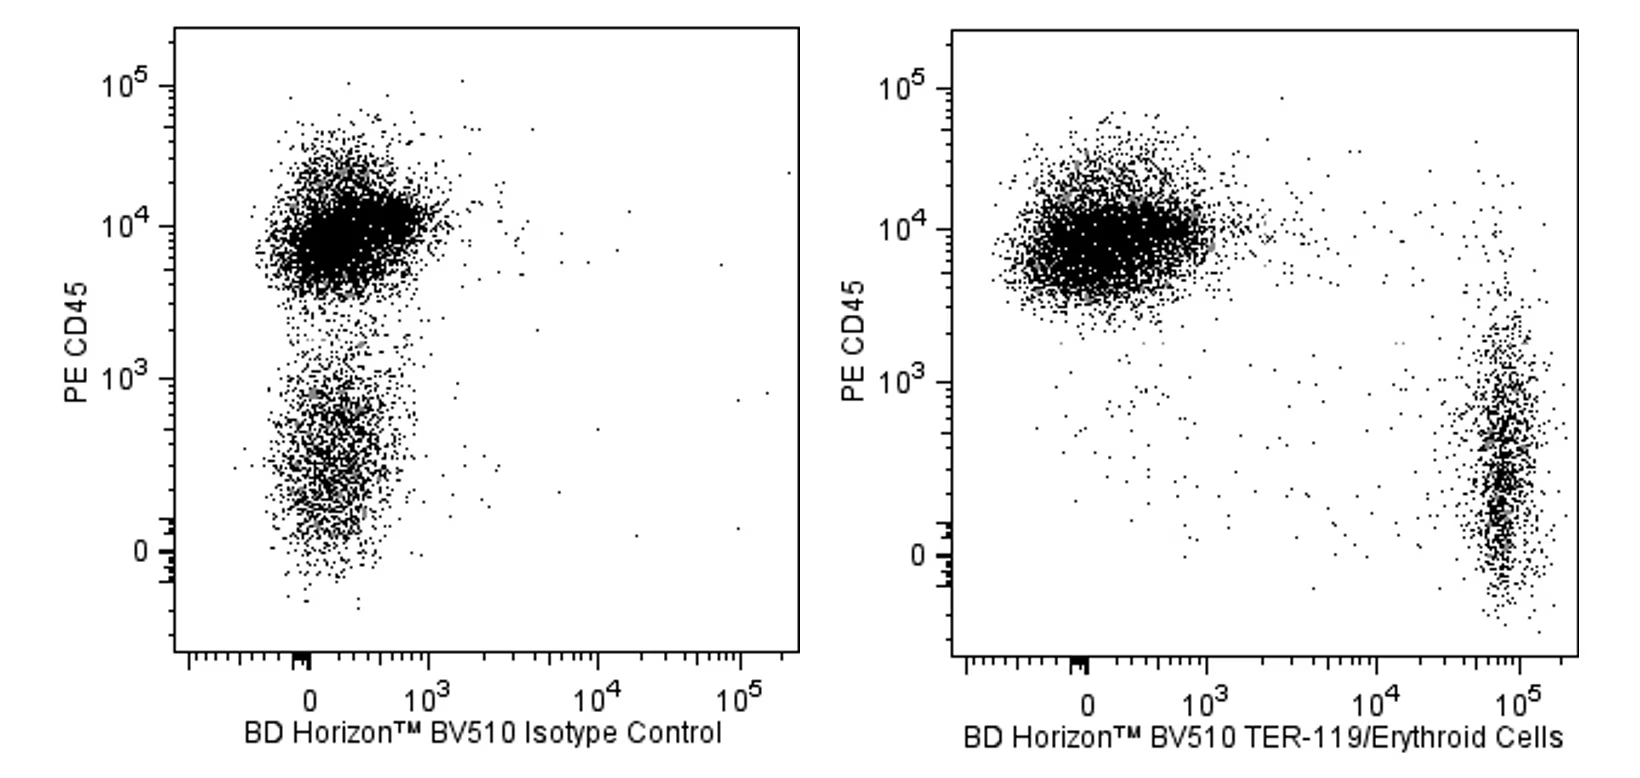
Two-color flow cytometric analysis of TER-119/Erythroid Cells expressed on mouse bone marrow cells. Mouse bone marrow cells were preincubated with Purified Rat Anti-Mouse CD16/CD32 (Mouse BD Fc Block™) antibody (Cat. no. 553141/553142). The cells were then stained with PE Rat Anti-Mouse CD45 antibody (Cat. No. 553081/561087) and either BD Horizon™ BV510 Rat IgG2b, κ Isotype Control (Cat. No. 562951; Left Panel) or BD Horizon™ BV510 Rat Anti-Mouse TER-119/Erythroid Cells antibody (Cat. No. 563995; Right Panel). Two-color flow cytometric dot plots showing the expressed levels of CD45 versus TER-119/Erythroid Cells (or Ig Isotype control staining) were derived from gated events with the light scattering characteristics of viable bone marrow cells. Flow cytometric analysis was performed using a BD™ LSR II Flow Cytometry System.
Two-color flow cytometric analysis of TER-119/Erythroid Cells expressed on mouse bone marrow cells. Mouse bone marrow cells were preincubated with Purified Rat Anti-Mouse CD16/CD32 (Mouse BD Fc Block™) antibody (Cat. no. 553141/553142). The cells were then stained with PE Rat Anti-Mouse CD45 antibody (Cat. No. 553081/561087) and either BD Horizon™ BV510 Rat IgG2b, κ Isotype Control (Cat. No. 562951; Left Panel) or BD Horizon™ BV510 Rat Anti-Mouse TER-119/Erythroid Cells antibody (Cat. No. 563995; Right Panel). Two-color flow cytometric dot plots showing the expressed levels of CD45 versus TER-119/Erythroid Cells (or Ig Isotype control staining) were derived from gated events with the light scattering characteristics of viable bone marrow cells. Flow cytometric analysis was performed using a BD™ LSR II Flow Cytometry System.