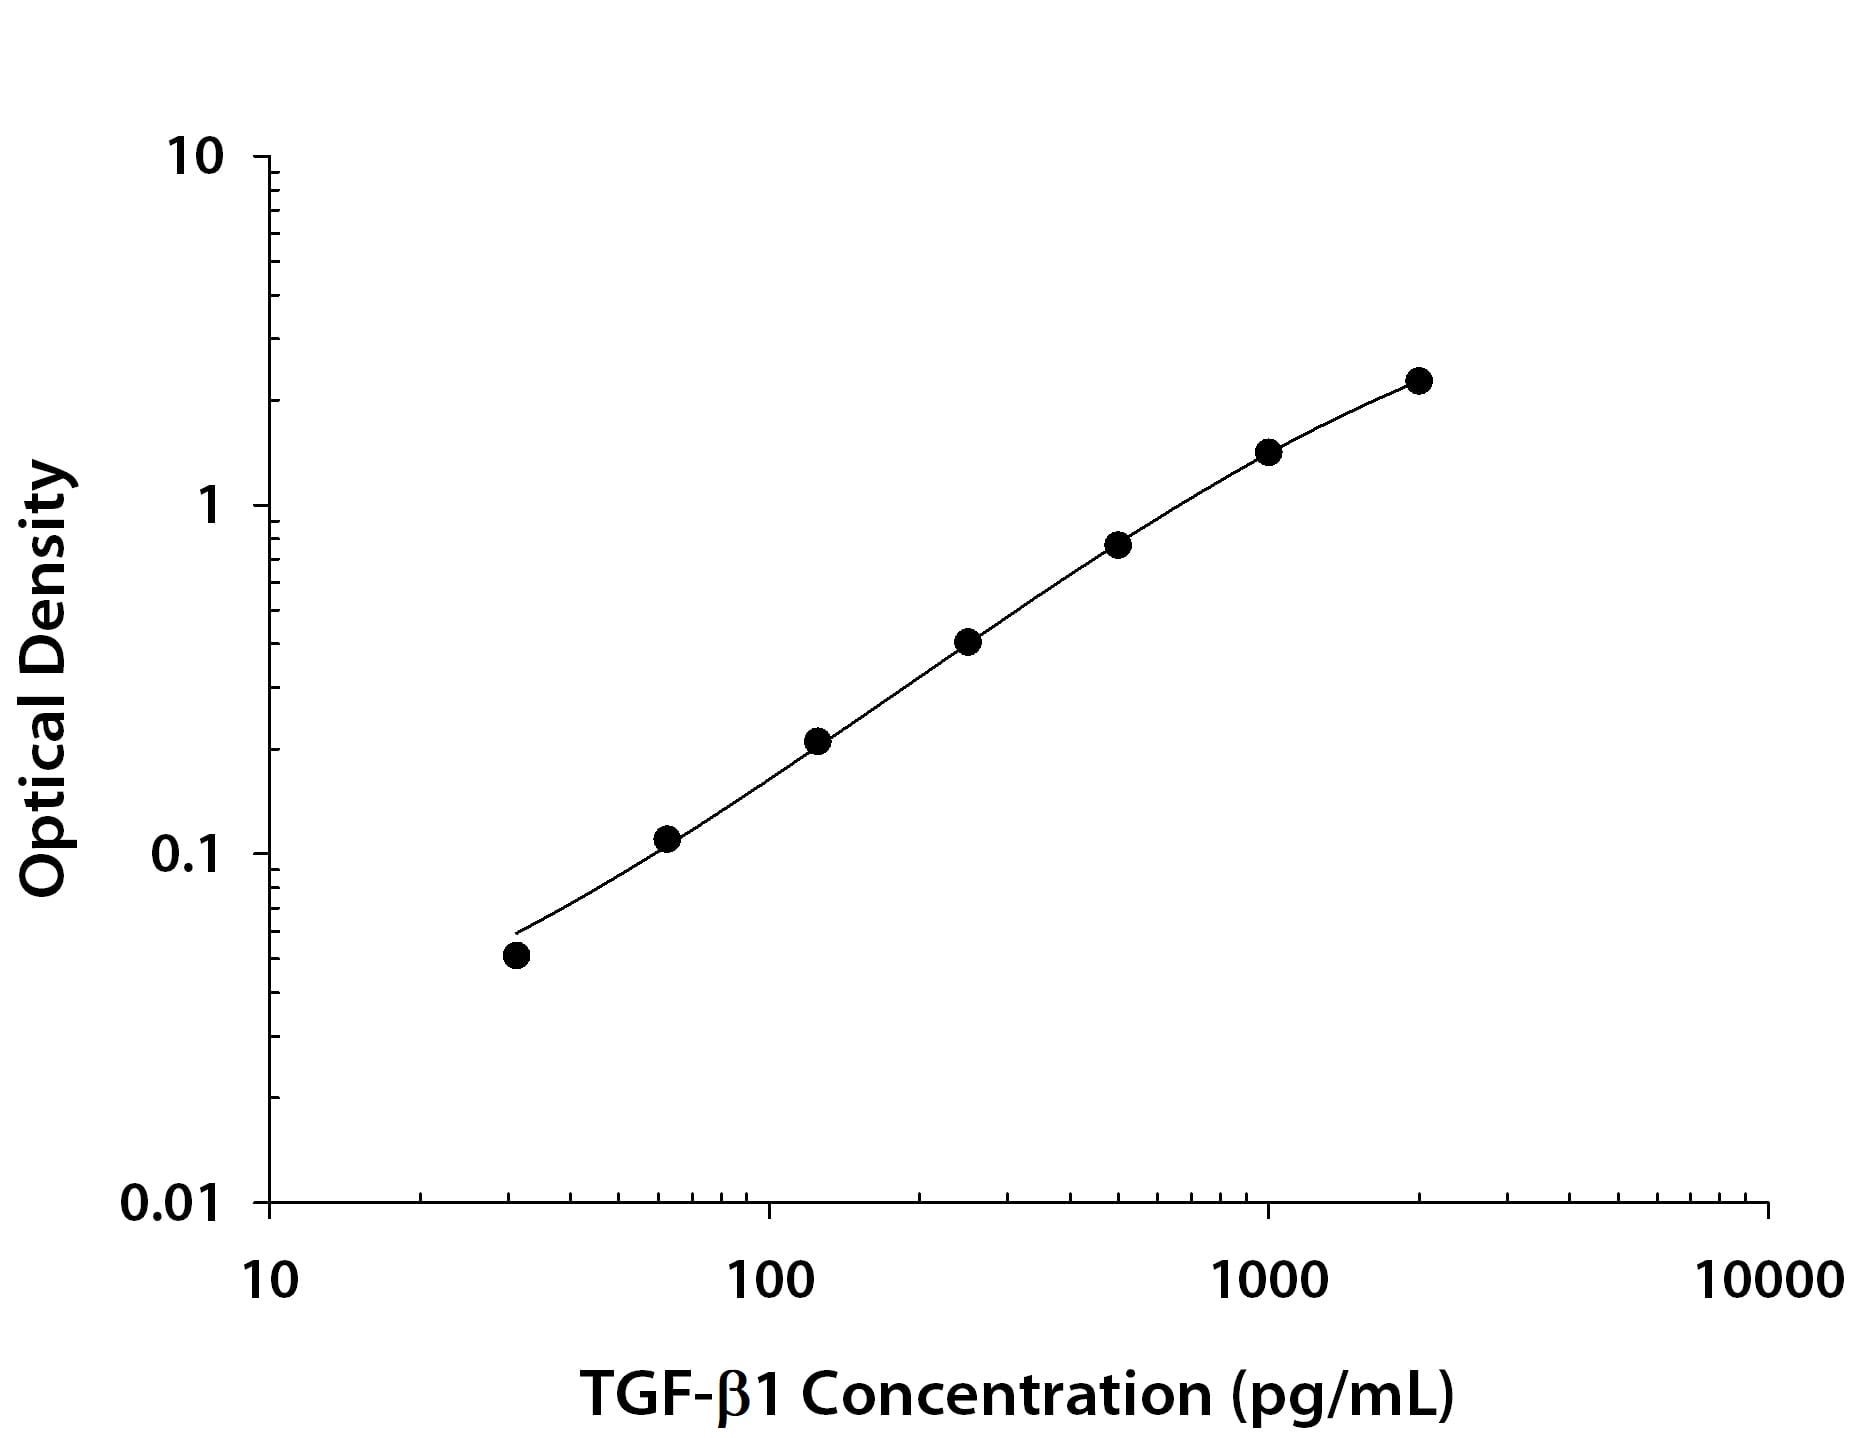
Sample Values
Serum/Plasma/Urine - Samples were evaluated for the presence of TGF-beta 1 in this assay.
| Human Samples | Mean (pg/mL) | Range (pg/mL) | Standard Devitation (pg/mL) |
| Serum (n=31) | 51,640 | 32,091-95,147 | 11,901 |
| platelet-poor EDTA plasma (n=31) | 2377 | 1414-4641 | 729 |
| Platelet-poor heparin plasma (n=31) | 2383 | 1445-3653 | 561 |
| Urine* (n=10) | 65.9 | ND-108 | --- |
*Only 40% of the urine samples meausered detectable levels (>31.3 pg/mL).
ND=Non-detectable
| Mouse Samples | Mean (pg/mL) | Range (pg/mL) | Standard Deviation (pg/mL) |
| Serum (n=10) | 97,352 | 78,751-114,130 | 12,623 |
| Platelet-poor EDTA plasma (n=10) | 41,763 | 16,577-68,505 | 16,887 |
| Platelet-poor heparin plasma (n=10) | 41,101 | 18,195-66,700 | 17,419 |
| Rat Samples | Mean (pg/mL) | Range (pg/mL) | Standard Deviation (pg/mL) |
| Serum (n=10) | 68,108 | 43,721-89,138 | 14,343 |
| Platelet-poor EDTA plasma (n=5) | 5833 | 4912-7820 | 1141 |
| Platelet-poor heparin plasma (n=5) | 13,971 | 5274-26,114 | 8392 |
| Porcine Samples | Mean (pg/mL) | Range (pg/mL) | Standard Deviation (pg/mL) |
| Serum (n=5) | 17,597 | 13,481-23,914 | 4146 |
| Platelet-poor EDTA plasma (n=5) | 1955 | 1530-2810 | 518 |
| Platelet-poor heparin plasma (n=5) | 1567 | 1111-2475 | 551 |
| Canine Samples | Mean (pg/mL) | Range (pg/mL) | Standard Deviation (pg/mL) |
| Serum (n=10) | 33,455 | 2193-79,590 | 19,795 |
| Platelet-poor EDTA plasma** (n=5) | 2195 | ND-2515 | — |
| Platelet-poor heparin plasma*** (n=5) | 3763 | ND-4278 | — |
**Only 60% of the EDTA plasma samples measured detectable levels with the required 40 fold dilution. Two of five samples read just below the standard curve (< 31.3 pg/mL).
***Only 80% of the heparin plasma samples measured detectable levels with the required 40 fold dilution. One of five samples read just below the standard curve (< 31.3 pg/mL).
SAMPLE VALUES CONTINUED
Cell Culture Supernates:
Human peripheral blood mononuclear cells (PBMCs) were separated from whole blood by a density gradient centrifugation method using Ficoll-Paque Plus. CD4+ T cells were isolated from PBMCs using the MagCellect™ Human CD4+ T cell Isolation Kit (R&D Systems®, Catalog # MAGH102). Cells were seeded at 5 x 10⁵ /mL and cultured using Excellerate™ Human T Cell Expansion Media, Xeno-Free (R&D Systems, Catalog # CCM030). T cells were left untreated or treated with 10 ng/mL GMP recombinant human (rh) IL-7 (R&D Systems, Catalog # 207-GMP), 10 ng/mL GMP rhIL-15 (R&D Systems, Catalog # 247-GMP), and stimulated via their T cell receptor (TCR) and co-stimulatory receptor for 5 days. TCR stimulation was mediated using 25 μL Cloudz™ CD3/28 particles (Cloudz T Cell Activation Kit - CD3/CD28, (R&D Systems, Catalog # CLD001) per mL of culture media. CD4+ T cells were maintained in a 5% CO2 incubator at 37 °C for 5 days. An aliquot of the cell culture supernates was removed, assayed for TGF-beta 1, and measured 77.7 pg/mL (untreated) and 471 pg/mL (treated).
Human PBMCs were seeded at 1 x 10⁶ /mL and cultured in RPMI supplemented with 10% fetal bovine serum (FBS), 2 mM L-glutamine, 100 U/mL penicillin, and 100 μg/mL streptomycin and left untreated. An aliquot of the cell culture supernate was removed, assayed for TGF-beta 1, and measured 2854 pg/mL.
Mouse EL-4 cells were cultured in DMEM High Glucose supplemented with 10% FBS, 2 mM L-glutamine, 100 U/mL penicillin, and 100 μg/mL streptomycin. Cells were then treated with 10 ng/mL PMA and 10 ug/mL PHA for 24 hours. An aliquot of the cell culture supernate was removed, assayed for TGF-beta 1, and measured 2969 pg/mL.
Rat spleen was taken from a pregnant Sprague Dawley rat, homogenized, and cultured in DME with 10% FBS, 2 mM L-glutamine, 100 U/mL penicillin, and 100 μg/mL streptomycin at 37 °C and 5% CO2 . Rat splenocytes were treated with 50 ng/mL recombinant rat IL-2 and 5 μg/mL PHA for 3 days. An aliquot of the cell culture supernate was removed, assayed for TGF-beta 1, and measured 2716 pg/mL.
Porcine PK-15 cells were cultured in MEM supplemented with 10% FBS, 2 mM L-glutamine, 100 U/mL penicillin, and 100 μg/mL streptomycin. Cells were treated with 1 μg/mL LPS for 72 hours. An aliquot of the cell culture supernate was removed, assayed for TGF-beta 1, and measured 1631 pg/mL.
Precision
Intra-Assay Precision (Precision within an assay) Three samples of known concentration were tested twenty times on one plate to assess intra-assay precision
Inter-Assay Precision (Precision between assays) Three samples of known concentration were tested in separate assays to assess inter-assay precision. Assays were performed by at least three technicians using two lots of components
Cell Culture Supernates, Serum, Platelet-poor Plasma, Platelet-poor EDTA Plasma, Urine
| Intra-Assay Precision | Inter-Assay Precision |
|---|
| Sample | 1 | 2 | 3 | 4 | 5 | 6 | 1 | 2 | 3 | 4 | 5 | 6 |
| n | 20 | 20 | 20 | 20 | 20 | 20 | 20 | 20 | 20 | 20 | 20 | 20 |
| Mean (pg/mL) | 317 | 683 | 1271 | 309 | 708 | 1072 | 312 | 657 | 1184 | 303 | 622 | 1092 |
| Standard Deviation | 11.3 | 42.2 | 31.1 | 15.3 | 40 | 44.3 | 26.1 | 46.6 | 92.3 | 21.2 | 47.2 | 70 |
| CV% | 3.6 | 6.2 | 2.4 | 5 | 5.6 | 4.1 | 8.4 | 7.1 | 7.8 | 7 | 7.6 | 6.4 |
 全部商品分类


 下载产品说明书
 下载SDS
下载SDS 用小程序,查商品更便捷


 收藏
收藏
 对比
对比 咨询
咨询


