


 全部商品分类


 下载产品说明书 下载SDS
 用小程序,查商品更便捷


 收藏
收藏
 对比
对比 咨询
咨询
参考图片
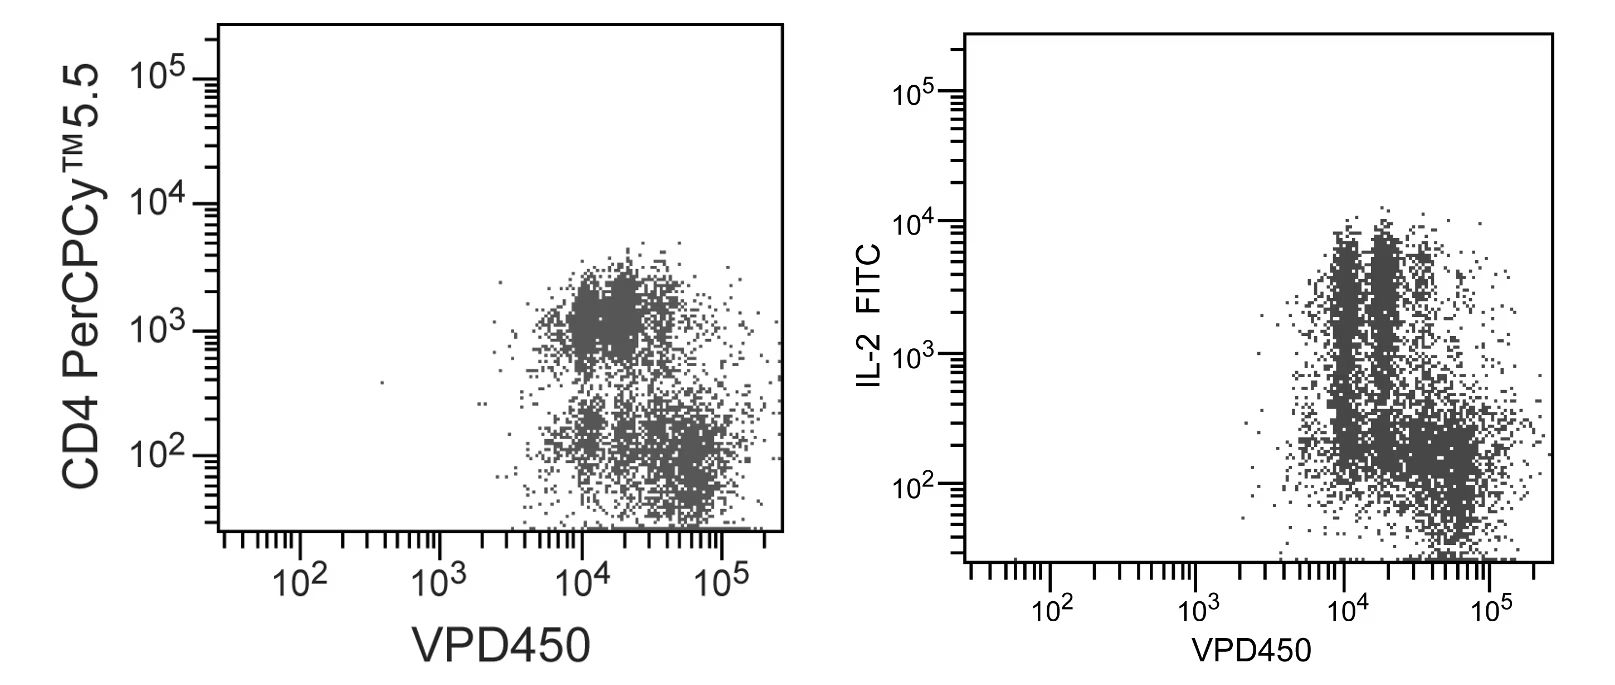
Figure 2. Staining of surface and intracellular phenotypes on activated mouse splenocytes. A single-cell suspension of mouse splenocytes was treated to remove red blood cells and then labeled with VPD450 (1 μM) for 10 minutes. The cells were washed twice and then cultured with Purified NA/LE Hamster Anti-Mouse CD3e (Cat. No. 553057) and Purified NA/LE Hamster Anti-Mouse CD28 (Cat. No. 553294) antibodies in complete tissue culture medium. After 2 days, the cells were harvested, washed, and restimulated with Phorbol 12-Myristate 13-Acetate and Ionomycin in the presence of BD GolgiStop™ Protein Transport Inhibitor (Cat. No. 554724) for 4 hrs. The cells were then fixed and permeabilized using a BD Cytofix/Cytoperm™ Fixation/Permeabilization Solution Kit (Cat No. 554715) followed by staining with PerCP-Cy™5.5 Anti-Mouse CD4 (Cat. No. 550954) and FITC Anti-Mouse IL-2 (Cat. No. 554427) antibodies. Two-color flow cytometric dot plots showing the correlated expression patterns of VPD450 versus CD4 (Left Panel) or IL-2 (Right Panel) were derived from gated events with the forward and side light-scatter characteristics of intact splenic lymphocytes. Flow cytometry was performed using a BD™ LSR II Flow Cytometer System.
Figure 1. Flow cytometric analysis of proliferative responses by human peripheral blood lymphocytes. A single-cell suspension of human peripheral blood mononuclear cells was labeled with VPD450 (1 μM) for 10 minutes. The cells were washed twice and then cultured with phytohemagglutinin for four days. The histogram shows VPD450 fluorescence peaks of gated events with the forward and side light-scatter characteristics of viable lymphocytes (successive generations of divided cells). Flow cytometry was performed using a BD™ LSR II Flow Cytometer System.
Figure 2. Staining of surface and intracellular phenotypes on activated mouse splenocytes. A single-cell suspension of mouse splenocytes was treated to remove red blood cells and then labeled with VPD450 (1 μM) for 10 minutes. The cells were washed twice and then cultured with Purified NA/LE Hamster Anti-Mouse CD3e (Cat. No. 553057) and Purified NA/LE Hamster Anti-Mouse CD28 (Cat. No. 553294) antibodies in complete tissue culture medium. After 2 days, the cells were harvested, washed, and restimulated with Phorbol 12-Myristate 13-Acetate and Ionomycin in the presence of BD GolgiStop™ Protein Transport Inhibitor (Cat. No. 554724) for 4 hrs. The cells were then fixed and permeabilized using a BD Cytofix/Cytoperm™ Fixation/Permeabilization Solution Kit (Cat No. 554715) followed by staining with PerCP-Cy™5.5 Anti-Mouse CD4 (Cat. No. 550954) and FITC Anti-Mouse IL-2 (Cat. No. 554427) antibodies. Two-color flow cytometric dot plots showing the correlated expression patterns of VPD450 versus CD4 (Left Panel) or IL-2 (Right Panel) were derived from gated events with the forward and side light-scatter characteristics of intact splenic lymphocytes. Flow cytometry was performed using a BD™ LSR II Flow Cytometer System.