


 全部商品分类
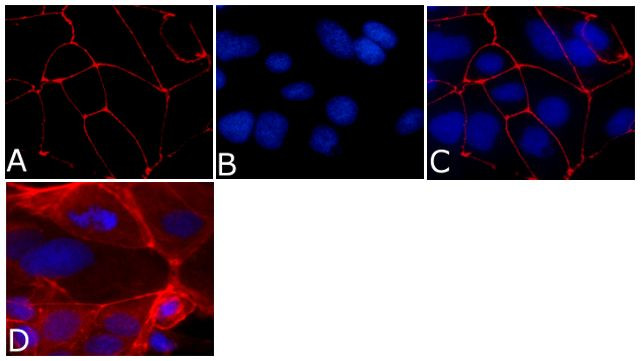


MS ANTI-ZO-1 AF594

 下载产品说明书 下载COA 下载SDS
 用小程序,查商品更便捷


 收藏
收藏
 对比
对比 咨询
咨询种属反应
已发表种属
宿主/亚型
分类
类型
克隆号
抗原
偶联物
激发/发射光谱

形式
浓度
纯化类型
保存液
内含物
保存条件
运输条件
RRID
靶标信息
ZO-1 forms complexes with either ZO-2 or ZO-3. In addition, these proteins can also associate with claudin, occludin and F-actin, at tight junction stands, where they provide a linkage between the actin cytoskeleton and the tight junction. ZO-1 expression is significantly reduced in many breast cancer lines. ZO-2 and ZO-3 are ubiquitously expressed within epithelial tight junctions, and unlike ZO-1, which is also expressed at cell junctions of cardiac myocytes, ZO-2 is not expressed in nonepithelial tissue. ZO-1 is a protein located on a cytoplasmic membrane surface of intercellular tight junctions. ZO-1 may be involved in signal transduction at cell-cell junctions. Two transcript variants encoding distinct isoforms have been identified for the ZO-1 gene. Diseases associated with ZO-1 dysfunction include Celiac Disease and Congenital Nephrotic Syndrome.
仅用于科研。不用于诊断过程。未经明确授权不得转售。
生物信息学
蛋白别名: DKFZp686M05161; MGC133289; OTTHUMP00000174520; Tight junction protein 1; tight junction protein 1 (zona occludens 1); Tight junction protein ZO-1; zona occludens 1; Zona occludens protein 1; zonula occludens 1 protein; Zonula occludens protein 1
基因别名: TJP1; ZO-1; ZO1
UniProt ID:(Dog) O97758, (Human) Q07157
Entrez Gene ID:(Dog) 403752, (Human) 7082
参考图片
Immunofluorescence analysis of ZO-1/TJP1 Antibody, Alexa Fluor® 594 conjugate (ZO1-1A12) was done on 90% confluent log phase CaCo2 cells. The cells were fixed with 4% paraformaldehyde for 15 minutes, permeabilized with 0.25% Triton™ X-100 for 10 minutes, and blocked with 5% BSA for 1 hour at room temperature. The cells were labeled with ZO-1/TJP1 Antibody, Alexa Fluor® 594 conjugate (ZO1-1A12) (Product # 339194) at 1µg/mL in 1% BSA and incubated for 3 hours at room temperature (Panel a: red). Nuclei (Panel b: blue) were stained with SlowFade® Gold Antifade Mountant with DAPI (Product # S36938). Panel c: red). Panel c is a merged image showing cell junctional localization. Panel d is a no primary antibody control. The images were captured at 40X magnification.
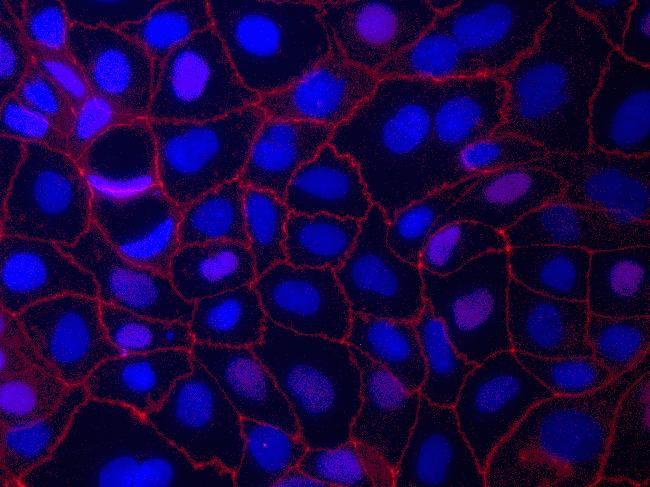
Immunofluorescent staining of ZO-1 in Human Caco-2 cells using mouse anti ZO-1 monoclonal antibody - Alexa Fluor® 594 (Product # 339194). DNA is counter stained with blue Hoechst 33258 (Product # H3569).
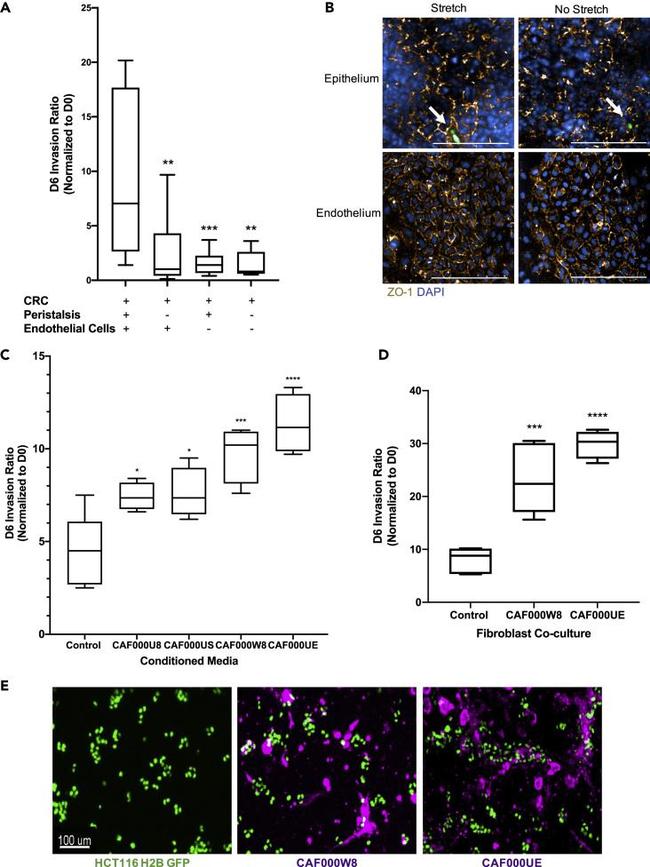
The TME influences tumor cell invasion (A) CRC-on-Chips were cultured in the presence of cyclic peristalsis-like mechanical strain and HUVECs (N = 12 Chips), without cyclic strain and with HUVECs (N = 12 Chips), with cyclic strain and without HUVEC cells (N = 12 Chips) or without cyclic strain or HUVECs (N = 9 Chips). The invasion ratio of the HCT116 cells was determined via microscopy. Data are represented as boxplots and analyzed using a 1-way ANOVA with multiple comparisons; **p < 0.01, ***p < 0.001. (B) Representative confocal immunofluorescent images of the epithelial (top) and endothelial (bottom) channels of the CRC-on-Chips in the presence (left) or absence (right) of peristalsis stained for ZO-1 (gold) on day 6. DAPI (blue) labels the nuclei of Caco2 C2BBe1 cells in the epithelial channel and HUVECs in the endothelial channel. White arrows indicate HCT116 cells. Scale bars represent 200 mum. Images are maximum projections that span a 15 mum Z-height in the epithelial channel and a 10 mum Z-height in the endothelial channel with a 5 mum step size. (C) Conditioned media from CAFs derived from four patients (N = 4 Chips for each patient-derived CAF) was flowed through the epithelial channel for the duration of the experiment. Differences in HCT116 cell invasion ratio quantification is depicted. Data are represented as boxplots and analyzed using 1-way ANOVA with multiple comparisons; *p < 0.05; ***p < 0.001; ****p < 0.0001. (D) Representative CAFs derived from two patie
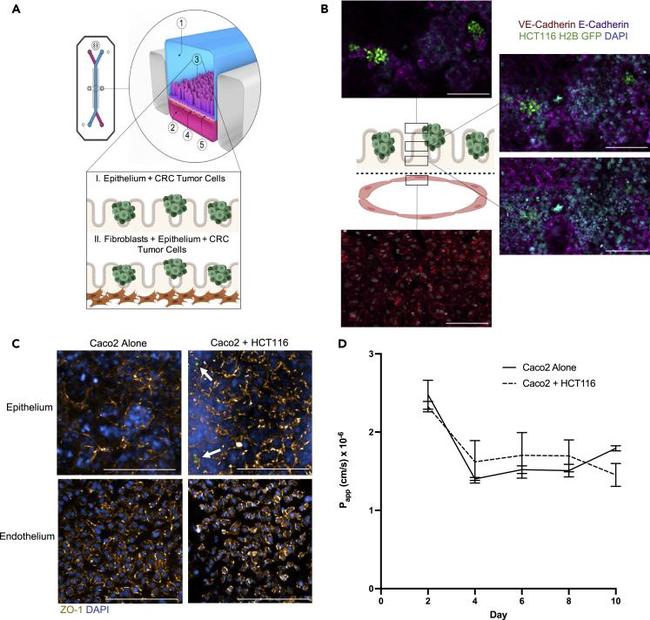
Figure 1 CRC-on-Chip tissue structure (A) The organ-on-chip platform (schematic courtesy of Emulate, Inc.) consists of an epithelial channel (1) comprising epithelial and cancerous cells (3) and an endothelial channel (2) comprising HUVEC cells (4) separated by a porous membrane (5). To model cell-cell interactions in the TME, the CRC-on-Chip was modified to include layers of different cell types in the epithelial channel. CRC tumor cells were seeded on top of the epithelial cells. A stromal layer, comprised of CAFs, can be incorporated into the epithelial channel. (B) Confocal fluorescence images of a chip cross-section spanning 106 mum from the top of the endothelial channel into the epithelial channel, highlighting the endothelial:epithelial tissue:tissue interface. HUVEC cells are labeled with anti-VE cadherin (red). Caco2 C2BBe1 cells labeled with anti-E-Cadherin (purple) form 3D-like structures in the top epithelial channel. HCT116 H2B-GFP cells grow in clusters on top of the Caco2 cells. Nuclei are labeled with DAPI (blue). Scale bar is 100 mum. (C) Representative confocal immunofluorescent images of the epithelial (top) and endothelial (bottom) channels of an Intestine Chip (left) and CRC-on-Chip (right) stained for ZO-1 (gold) on day 6. DAPI (blue) labels the nuclei of the Caco2 C2BBe1 cells in the epithelial channel and HUVECs in the endothelial channel. White arrows designate HCT116 (green) in the epithelial channel of the CRC-on-Chip. Scale bars represent 200 mum.
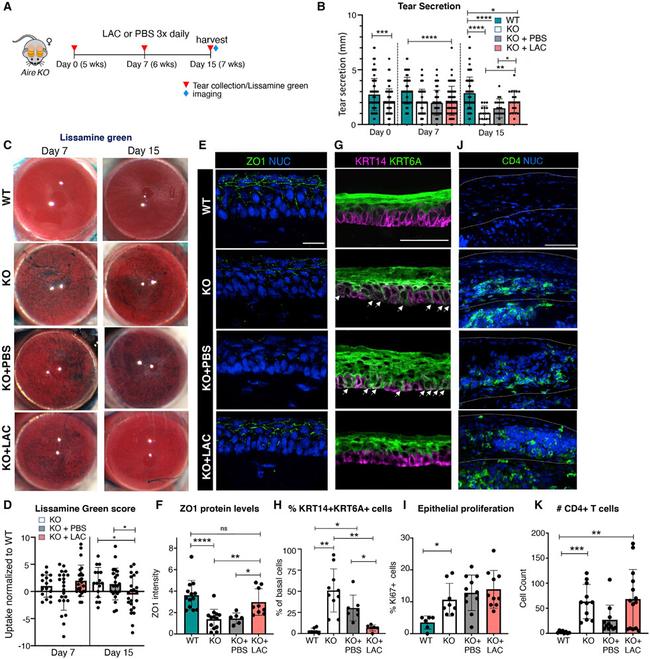
Figure 1. Physiological tear secretion, epithelial integrity, and basal progenitor cell identity are restored with Lacripep treatment during dry eye disease progression (A) Schematic of treatment regimen showing data collection time points for tissue analysis. (B) Levels of physiological (unstimulated) tear secretion at days 0, 7, and 15. (C and D) Lissamine green uptake in untreated/treated Aire KO corneas compared with age-matched WT as assessed by scoring intensity of stain at days 7 and 15. The day 7 score was normalized to day 0 (before treatment) and the day 15 score was normalized to day 7. Data points above 1 indicate increased lissamine green uptake, while points below 1 indicate reduced uptake. NUC, nuclei. (E-H) Immunofluorescent analysis and quantification of the tight junction protein ZO1 (E and F, scale bar, 20mum) and basal progenitor cell marker KRT14 and differentiation marker KRT6A (G and H, scale bar, 50mum) at day 15. Arrows in (G) highlight basal cells co-expressing KRT6A and KRT14. The graph in (H) shows the percentage of basal KRT14+ cells co-expressing KRT6A. (I) Quantification of proliferating epithelial cells at day 15. (J-K) Immunofluorescent analysis and quantification of CD4+ T cells in WT and untreated/treated Aire KO corneas at day 15. Scale bar, 50 mum. *p < 0.05, **p < 0.01, ***p < 0.001, ****p < 0.0001; n.s., not significant. A one-way analysis of variance was applied to graphs (B, D, F, H, and K) with the following post-hoc tests: a Tukey&ap
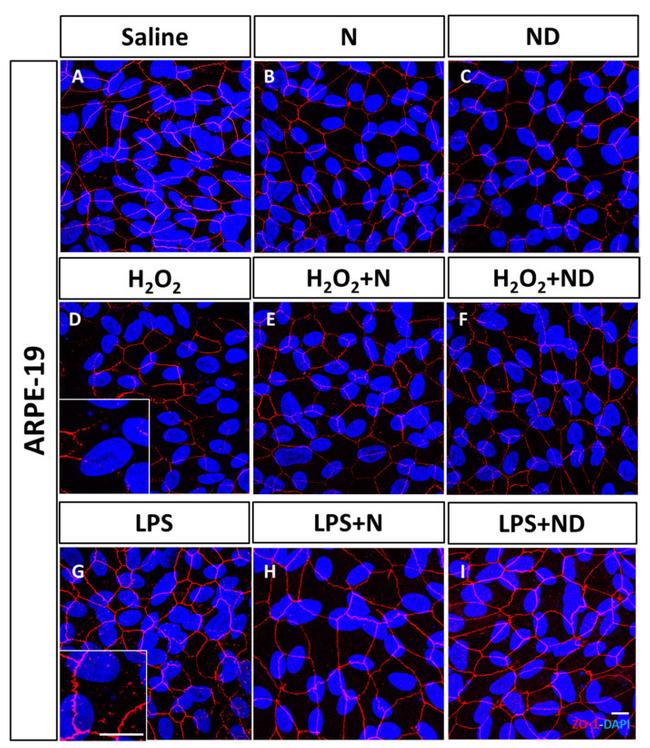
Figure 1 Junctional integrity of ARPE-19 cells evaluated by ZO-1 (red) fluorescence under a confocal imaging system. Application of N and ND treatments (62.34 mug/mL each) did not affect tight junctions, cell integrity, and structure ( B , C ) compared to saline ( A ). Addition of H 2 O 2 (2h; 1600 muM) and LPS (24 h; 20 mug/mL) to induce oxidative stress and inflammatory-like conditions, respectively, damaged tight junctions ( D , G ), while incubation with N and ND treatments during the last hour of the induction recovered the altered structure ( E , F , H , I ). Nuclei were labelled with DAPI (blue). Scale bar: 20 um.
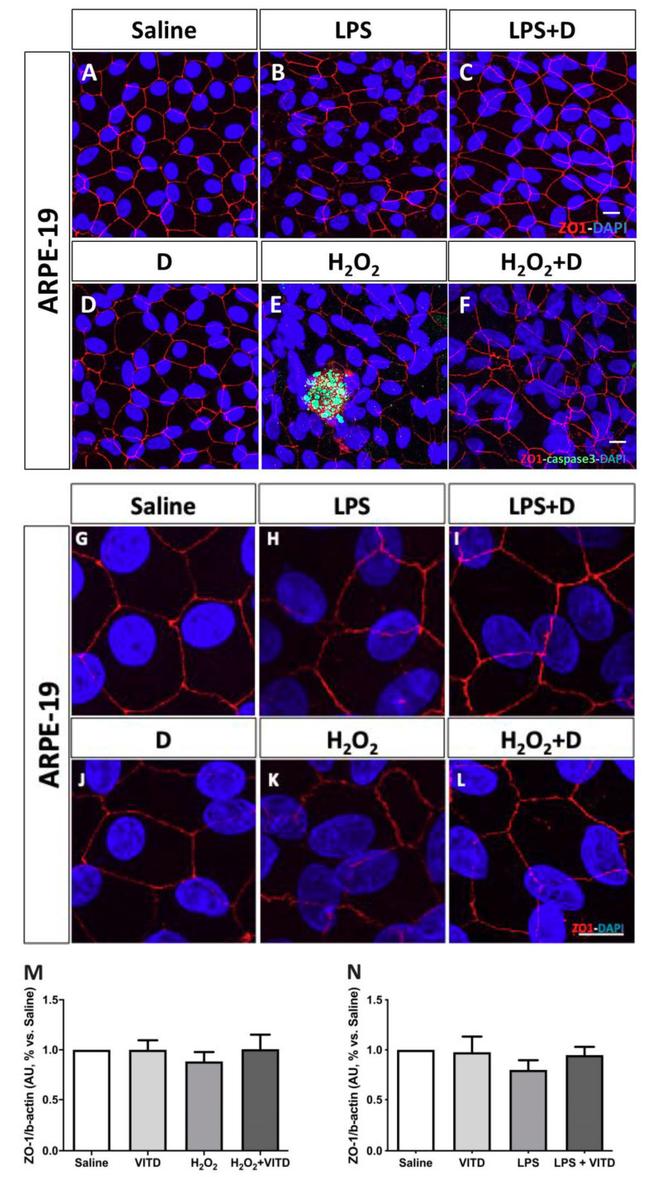
Figure 4 Integrity of ARPE-19 cells evaluated by zonula occludens-1 (ZO-1) (red) and caspase-3 (green) immunofluorescence. VITD (1 nM, 1 h; ( D )) did not affect ZO-1 structure compared to saline ( A , G ). Lipopolysaccharide (LPS) ( B , H ) and H 2 O 2 ( E , K ) addition damaged tight junctions and concomitant incubation with VITD (1 nM, 1 h; ( C , I ) and ( F , L )) restored the altered structure. ( G-L ) show the apical junction in higher magnification. Caspase-3 was highly observed in the H 2 O 2 group ( E ) compared to saline ( A ) and VITD ( D ). VITD addition showed restoration, and caspase-3 activation was absent ( F ). Nuclei were labeled with DAPI (blue). Scale bar: 20 um. Densitometry of ZO-1 expression in ARPE-19 cells under oxidative stress ( M ) and inflammatory ( N ) conditions. Although a tendency to reduce the ZO-1 expression was observed, no statistical differences were found. VITD restored values similar to saline group. n = 3.
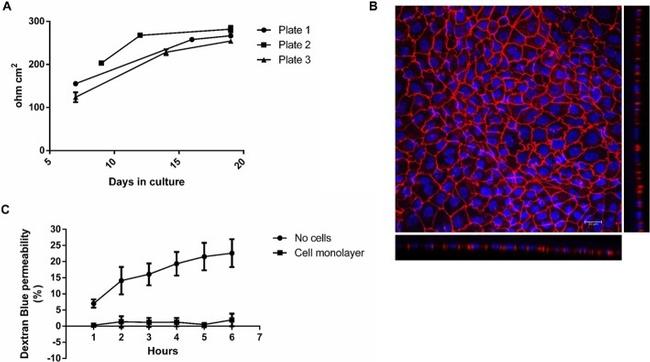
Fig. 1 a-c Quality control steps for the cultivation of Caco-2 cells on filter inserts. Increase in TEER over the cultivation period ( a ). Caco-2 cells were seeded onto filter inserts applying Protocol #2 and TEER was measured as detailed in Supplementary Protocol #3 (Additional file 1 ). The data points represent mean +- SD from three inserts from the respective plate. Representative image of a Caco-2 cell monolayer grown on a filter insert for 21 days ( b ). Depicted is a maximum projection of the top view and the optical cross sections obtained by CLSM. Cell nuclei are shown in blue (DAPI) and the tight junction protein ZO-1 in red (Alexa Fluor 594 conjugated anti ZO-1 antibody). Staining was carried out as described in Protocol #6. Dextran Blue permeability of a filter insert without cells and a filter insert with a fully differentiated cell monolayer ( c ). Filter inserts were incubated with Dextran Blue as described in Supplementary Protocol #4 (Additional file 1 ) over a period of 6 h and sampling every hour. The data points represent mean +- SD from three to four independent experiments
Published figure using ZO-1 monoclonal antibody (Product # 339194) in Immunocytochemistry and Immunohistochemistry
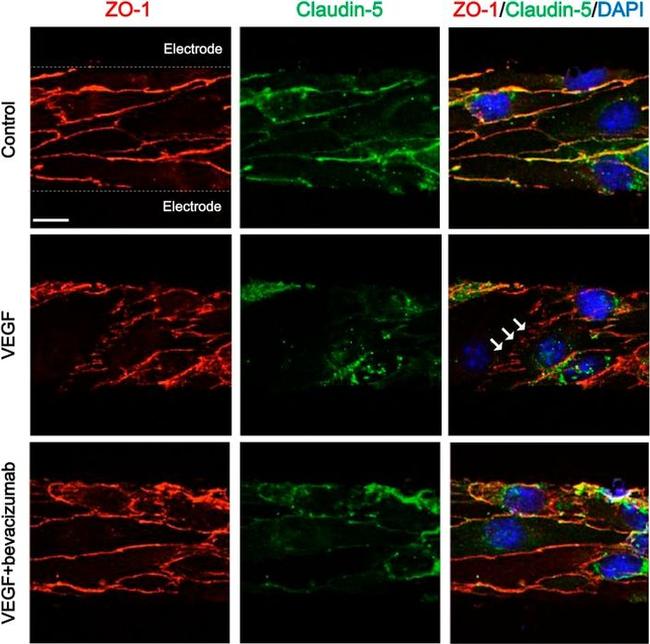
Figure 5 Immunocytochemical staining of tight junction proteins in cerebral endothelial cells with different paracellular permeability. White arrows indicate disrupted alignment of tight junction proteins. Scale bars, 10 mum.
Published figure using ZO-1 monoclonal antibody (Product # 339194) in Immunocytochemistry
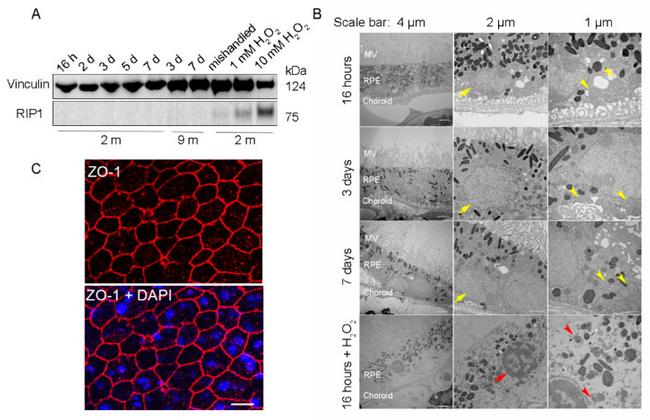
Figure 2 RPE flatmounts are viable for at least one week after culture in vitro . ( A ) RPE flatmounts were prepared from 2- and 9-month-old wild-type C57BL/6J mice and cultured in complete medium with or without H 2 O 2 for up to one week. Protein lysates were prepared from the RPE flatmounts and subjected to Western blotting analysis. The cell death marker RIP1 was used to evaluate cell viability; vinculin was used as an internal control. As a positive control: RPE flatmounts treated with either 1 mM or 10 mM H 2 O 2 had significant expression of RIP1. Further, the RPE flatmount that was cultured for 7 days without changing the medium (mishandled sample) showed a slight amount of RIP1, whereas the RPE flatmounts cultured with frequent medium changes did not express RIP1, suggesting that the RPE cells obtained even from older mice (9 months) were viable after at least 7 days of culture. ( B ) RPE flatmounts were obtained from 3-month-old wild-type C57BL/6J mice and cultured in complete medium with or without H 2 O 2 treatment for up to one week. RPE flatmounts were then fixed in 2.5% glutaraldehyde and processed for transmission electron microscopy (TEM). The TEM imaging of the RPE flatmounts cultured for 16 h, 3 days, and 7 days showed that these RPE cells have normal nuclei (yellow arrows) and organelles, such as mitochondria (yellow arrowheads), and abundant microvilli. H 2 O 2 -treated RPE flatmounts showed cell death symptoms, including chromatin condensation and fragme
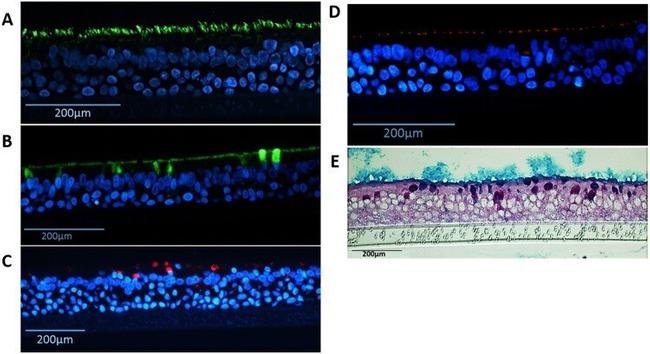
Figure 6 Detection of differentiated cells in NHBE pseudostratified epithelial layer generated from passage 1 cultures. Immunofluorescence for ( A ) Ciliated cells (alpha-tubulin, green), ( B ) goblet cells (MUC5B, green), ( C ) goblet cells (MUC5AC, red), ( D ) ZO-1 tight junctions (red), nuclear stain (DAPI - blue); and staining for ( E ) periodic acid-Schiff/alcian blue for mucus producing goblet cells.
Published figure using ZO-1 monoclonal antibody (Product # 339194) in Immunohistochemistry
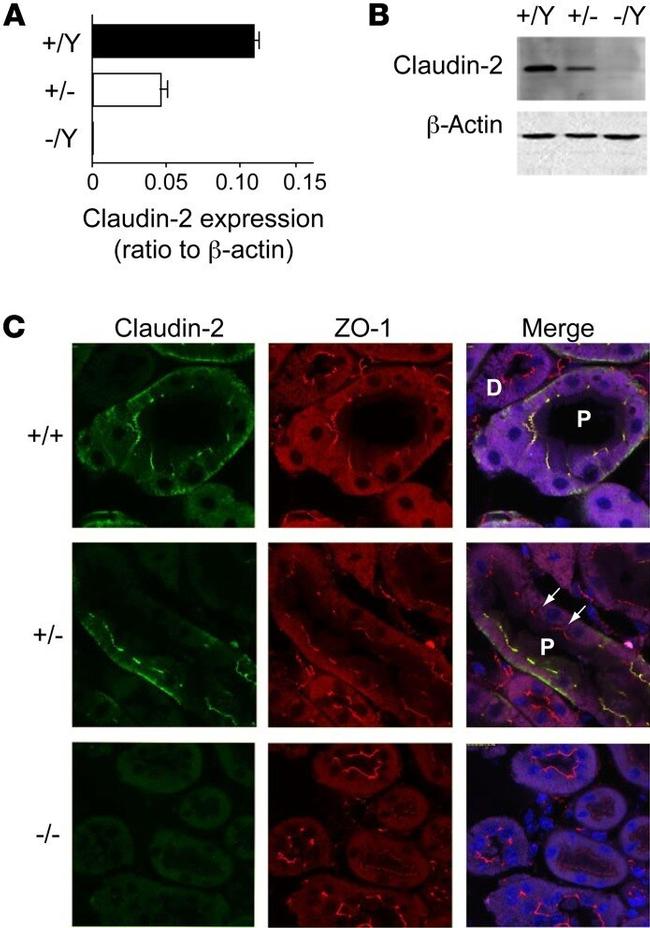
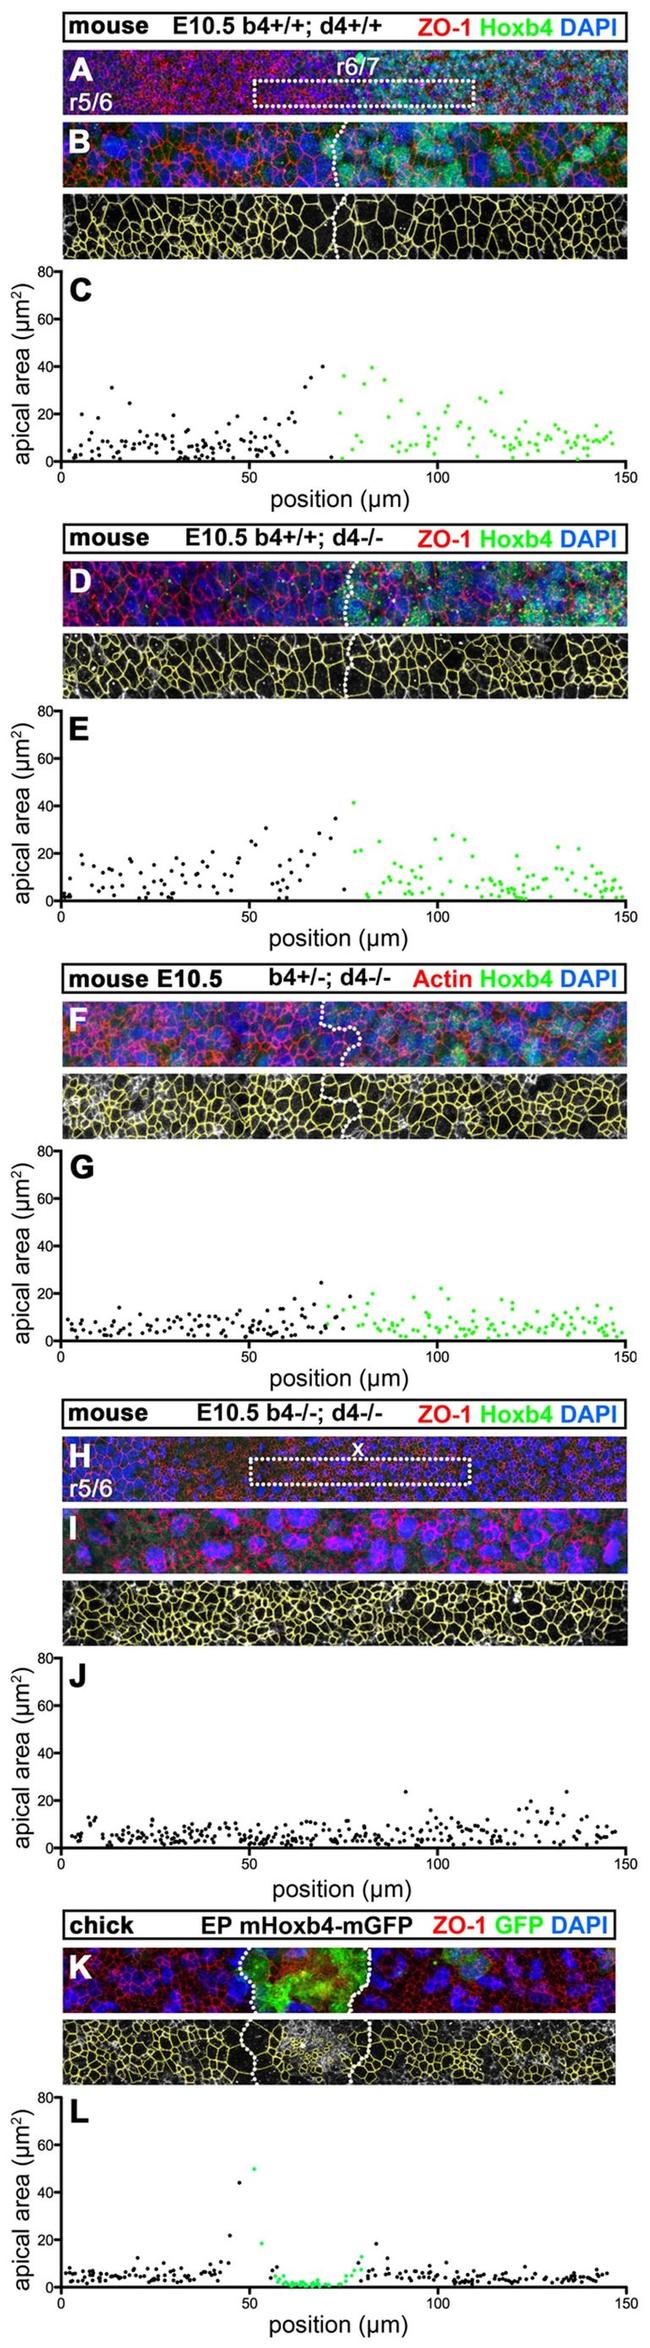
Fig. 6. Hox4 proteins are necessary and sufficient to induce non-autonomous apical cell enlargement. (A-H) Confocal immunostaining for Hoxb4 (green) and ZO-1 (red) on E10.5 flat-mounted mouse hindbrains of wild-type ( Hoxb4 +/+ ; Hoxd4 +/+ ) (A,B), Hoxb4 +/+ ; Hoxd4 -/- (D), Hoxb4 +/- ; Hoxd4 -/- (F) and Hox4 double-mutant (H,I) embryos at a lateral level of the r6/r7 boundary region. The r6/r7 boundary or its presumptive position (x) are indicated in A and H. (B,I) Confocal z-projections of similar magnifications of the r6/r7 boundary region as in D (corresponding to dotted boxes in A and H) showing the apical cell outlines (yellow) used for quantitation. (C,E,G,J) Apical areas (mum 2 ) with respect to the anteroposterior position of the cells in B,D,F,I, respectively. Hoxb4 + (green) and Hoxb4 - (black) cells are indicated. (K,L) Confocal z -projections and ZO-1 apical outlines (yellow) of the chick r5 neuroepithelium electroporated with mouse Hoxb4-mGFP . (K) Mouse Hoxb4/GFP + cells (green) form a cluster with a well-defined interface (dotted line). (L) Corresponding apical cell areas (mum 2 ) with respect to anteroposterior position for mouse Hoxb4 + (green) and mouse Hoxb4 - (black) cells. Anterior is towards the left.